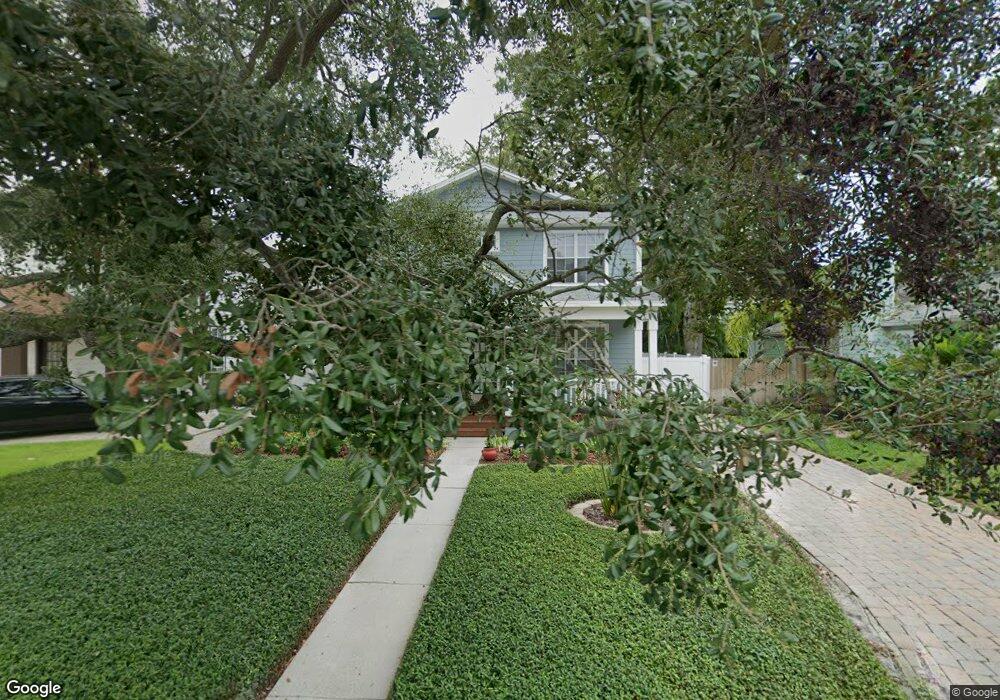
4306 W Leona St Tampa, FL 33629
Virginia Park NeighborhoodEstimated Value: $1,053,175 - $1,494,000
4
Beds
3
Baths
3,372
Sq Ft
$350/Sq Ft
Est. Value
About This Home
This home is located at 4306 W Leona St, Tampa, FL 33629 and is currently estimated at $1,181,794, approximately $350 per square foot. 4306 W Leona St is a home located in Hillsborough County with nearby schools including Mabry Elementary School, Coleman Middle School, and Plant High School.
Ownership History
Date
Name
Owned For
Owner Type
Purchase Details
Closed on
May 23, 2013
Sold by
Wisniewski Michael C and Wisniewski Rhonda B
Bought by
Lessinger Michael A and Lessinger Claire A
Current Estimated Value
Home Financials for this Owner
Home Financials are based on the most recent Mortgage that was taken out on this home.
Original Mortgage
$417,000
Outstanding Balance
$294,825
Interest Rate
3.43%
Mortgage Type
New Conventional
Estimated Equity
$886,969
Purchase Details
Closed on
Aug 19, 1997
Sold by
Beazer Homes Corp
Bought by
Wisniewski Michael C and Wisniewski Rhonda B
Home Financials for this Owner
Home Financials are based on the most recent Mortgage that was taken out on this home.
Original Mortgage
$196,000
Interest Rate
7.65%
Mortgage Type
New Conventional
Purchase Details
Closed on
Dec 17, 1996
Sold by
Thorson Jeffrey D and Thorson Burns J
Bought by
Beazer Homes Corp
Purchase Details
Closed on
May 15, 1996
Sold by
Pflug Ronald W and Pflug L
Bought by
Thorson Jeffrey D and Burns Kevin J
Create a Home Valuation Report for This Property
The Home Valuation Report is an in-depth analysis detailing your home's value as well as a comparison with similar homes in the area
Home Values in the Area
Average Home Value in this Area
Purchase History
| Date | Buyer | Sale Price | Title Company |
|---|---|---|---|
| Lessinger Michael A | $540,000 | Smith & Associates Title Inc | |
| Wisniewski Michael C | $245,000 | -- | |
| Beazer Homes Corp | $110,000 | -- | |
| Thorson Jeffrey D | $78,000 | -- |
Source: Public Records
Mortgage History
| Date | Status | Borrower | Loan Amount |
|---|---|---|---|
| Open | Lessinger Michael A | $417,000 | |
| Previous Owner | Thorson Jeffrey D | $198,000 | |
| Previous Owner | Thorson Jeffrey D | $196,000 |
Source: Public Records
Tax History Compared to Growth
Tax History
| Year | Tax Paid | Tax Assessment Tax Assessment Total Assessment is a certain percentage of the fair market value that is determined by local assessors to be the total taxable value of land and additions on the property. | Land | Improvement |
|---|---|---|---|---|
| 2024 | $13,794 | $774,436 | $265,740 | $508,696 |
| 2023 | $12,504 | $676,525 | $247,200 | $429,325 |
| 2022 | $11,715 | $662,704 | $234,840 | $427,864 |
| 2021 | $10,420 | $519,896 | $185,400 | $334,496 |
| 2020 | $9,551 | $472,890 | $185,400 | $287,490 |
| 2019 | $9,510 | $467,150 | $179,220 | $287,930 |
| 2018 | $9,258 | $448,112 | $0 | $0 |
| 2017 | $8,588 | $411,263 | $0 | $0 |
| 2016 | $8,251 | $396,710 | $0 | $0 |
| 2015 | $7,581 | $360,645 | $0 | $0 |
| 2014 | $7,915 | $376,503 | $0 | $0 |
| 2013 | -- | $244,512 | $0 | $0 |
Source: Public Records
Map
Nearby Homes
- 4305 W Leona St
- 4408 W Leona St
- 4306 W Corona St
- 4224 W Corona St
- 4311 W Sevilla St
- 3309 E Sevilla Cir
- 4302 W San Pedro St
- 4503 W Longfellow Ave
- 4504 W Lamb Ave
- 4310 W Sevilla St
- 4309 W San Pedro St
- 4220 W Sevilla St
- 4205 W Obispo St
- 4515 W Leona St
- 4314 W Vasconia St
- 4208 W Vasconia St
- 4108 W Tacon St
- 4111 W Obispo St
- 4417 W El Prado Blvd
- 4419 W El Prado Blvd
- 4304 W Leona St
- 4308 W Leona St
- 4302 W Leona St
- 4305 W Corona St
- 4303 W Corona St
- 4310 W Leona St
- 4307 W Corona St
- 4301 W Corona St
- 4307 W Leona St
- 4301 W Leona St
- 4309 W Corona St
- 4222 W Leona St
- 4312 W Leona St
- 4311 W Leona St
- 4223 W Corona St
- 4311 W Corona St
- 4221 W Leona St
- 4315 W Leona St
- 4218 W Leona St
- 4318 W Leona St