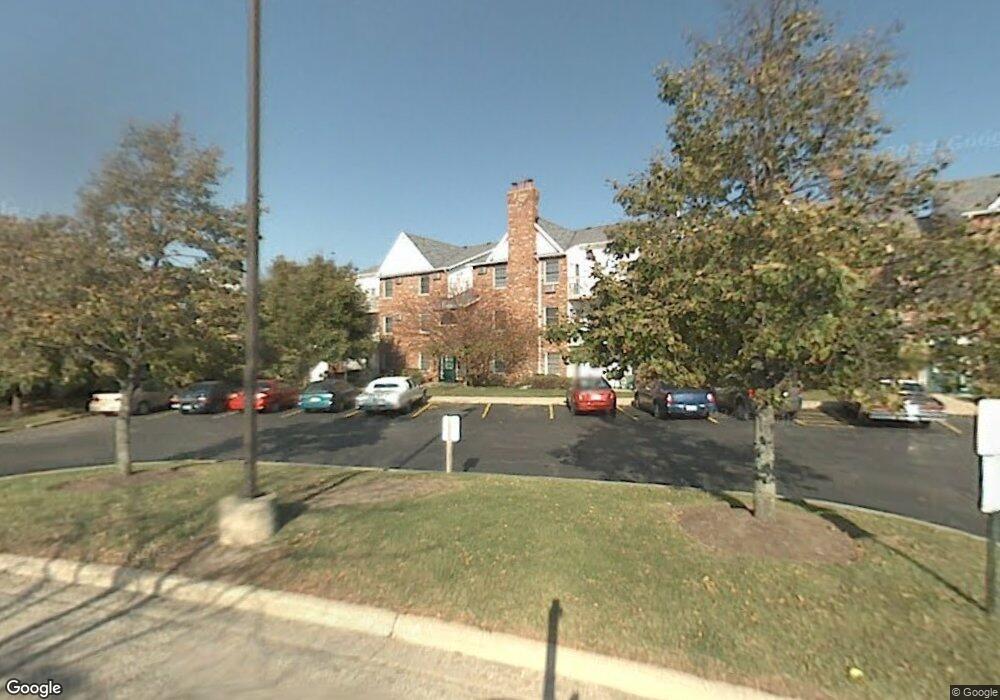
4306 W Shamrock Ln McHenry, IL 60050
Estimated Value: $143,000 - $166,000
2
Beds
4
Baths
1,010
Sq Ft
$156/Sq Ft
Est. Value
About This Home
This home is located at 4306 W Shamrock Ln, McHenry, IL 60050 and is currently estimated at $157,155, approximately $155 per square foot. 4306 W Shamrock Ln is a home located in McHenry County with nearby schools including Riverwood Elementary School, Parkland School, and McHenry Community High School - Upper Campus.
Ownership History
Date
Name
Owned For
Owner Type
Purchase Details
Closed on
Mar 21, 2021
Sold by
Wolf Linda M and Kalnicky Linda
Bought by
Dulanto Carlos and Kostiuk Olga
Current Estimated Value
Purchase Details
Closed on
Dec 14, 2018
Sold by
Wolf Linda M and Kalnicky Linda M
Bought by
Fish Leona V and Dier Donna F
Purchase Details
Closed on
Dec 6, 2016
Sold by
Stusowski Stacey
Bought by
Kalnicky Linda M
Purchase Details
Closed on
Nov 11, 2010
Sold by
Leaf Linda L
Bought by
Wolff Linda
Purchase Details
Closed on
Sep 12, 2008
Sold by
Member Insurance Agency Inc
Bought by
Leaf Linda L
Home Financials for this Owner
Home Financials are based on the most recent Mortgage that was taken out on this home.
Original Mortgage
$114,908
Interest Rate
6.55%
Mortgage Type
FHA
Purchase Details
Closed on
Mar 20, 2003
Sold by
Foley Thomas M
Bought by
Member Insurance Agency Inc
Create a Home Valuation Report for This Property
The Home Valuation Report is an in-depth analysis detailing your home's value as well as a comparison with similar homes in the area
Home Values in the Area
Average Home Value in this Area
Purchase History
| Date | Buyer | Sale Price | Title Company |
|---|---|---|---|
| Dulanto Carlos | $105,000 | None Available | |
| Fish Leona V | -- | First United Title Services | |
| Kalnicky Linda M | -- | None Available | |
| Wolff Linda | $65,850 | Fidelity | |
| Leaf Linda L | $117,000 | Lawyers Title Insurance Corp | |
| Member Insurance Agency Inc | $107,500 | Ht |
Source: Public Records
Mortgage History
| Date | Status | Borrower | Loan Amount |
|---|---|---|---|
| Previous Owner | Leaf Linda L | $114,908 |
Source: Public Records
Tax History Compared to Growth
Tax History
| Year | Tax Paid | Tax Assessment Tax Assessment Total Assessment is a certain percentage of the fair market value that is determined by local assessors to be the total taxable value of land and additions on the property. | Land | Improvement |
|---|---|---|---|---|
| 2024 | $3,474 | $41,273 | $3,978 | $37,295 |
| 2023 | $3,407 | $37,012 | $3,567 | $33,445 |
| 2022 | $2,541 | $32,803 | $3,161 | $29,642 |
| 2021 | $3,005 | $30,755 | $2,964 | $27,791 |
| 2020 | $2,987 | $29,833 | $2,875 | $26,958 |
| 2019 | $2,923 | $28,363 | $2,733 | $25,630 |
| 2018 | $2,372 | $20,732 | $2,217 | $18,515 |
| 2017 | $2,343 | $19,862 | $2,124 | $17,738 |
| 2016 | $2,319 | $18,951 | $2,027 | $16,924 |
| 2013 | -- | $27,147 | $1,930 | $25,217 |
Source: Public Records
Map
Nearby Homes
- 4302 W Shamrock Ln Unit 2G
- 4304 W Shamrock Ln Unit 1A
- Lot 48-53 Ridgeview Dr
- 702 S Il Route 31
- 615 Kresswood Dr
- 220 S Glenbrook Trail
- 1100 S Illinois Route 31
- 1510 S Illinois Route 31
- 4240 Savoy Ln
- 0000 Veterans Pkwy
- 5198 Bull Valley Rd
- 2267 Concord Dr Unit 2267
- 3216 Biscayne Rd
- 2002 S Illinois Route 31
- 3732 Flynn St
- 3205 W Vista Terrace
- 304 Whitaker Trail Unit 24
- 613 S Broadway St
- 0 S Broadway St
- 5320 Cobblers Crossing Unit 173
- 4302 W Shamrock Ln
- 4306 W Shamrock Ln Unit 43062B
- 4302 W Shamrock Ln
- 4302 W Shamrock Ln
- 4306 W Shamrock Ln
- 4302 W Shamrock Ln
- 4306 W Shamrock Ln
- 4302 W Shamrock Ln Unit 4302C
- 4308 W Shamrock Ln Unit 2A
- 4302 W Shamrock Ln
- 4306 W Shamrock Ln Unit 1C
- 4308 W Shamrock Ln Unit 2C
- 4306 W Shamrock Ln Unit 2A
- 4306 W Shamrock Ln Unit 3B
- 4308 W Shamrock Ln Unit 1D
- 4308 W Shamrock Ln Unit 1C
- 4302 W Shamrock Ln Unit 3F
- 4302 W Shamrock Ln Unit 3A
- 4302 W Shamrock Ln
- 4302 W Shamrock Ln Unit 3G