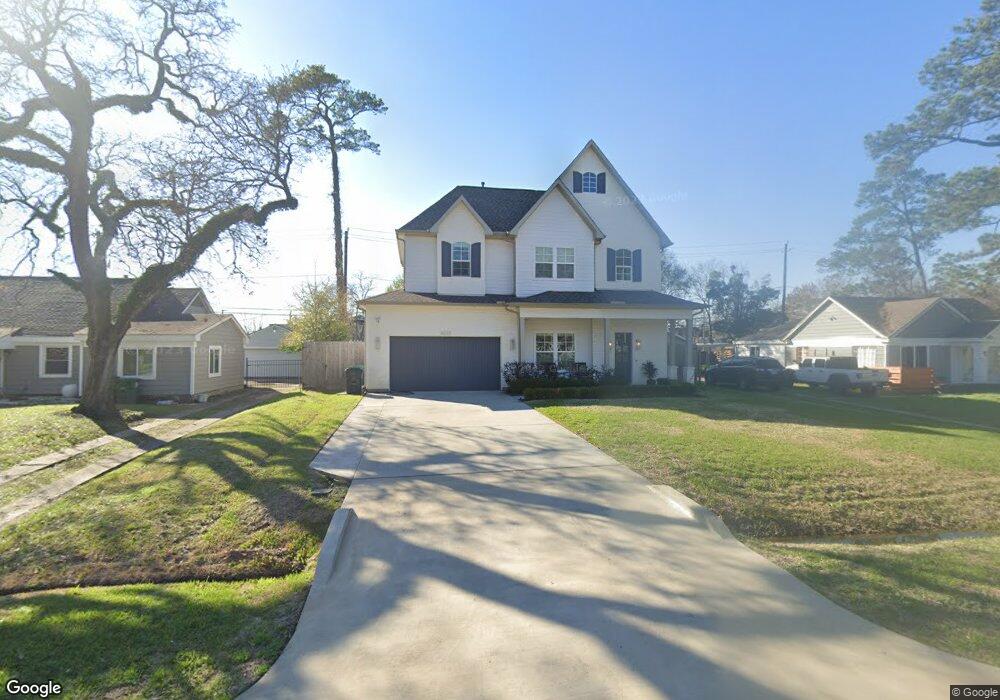
4307 Apollo St Houston, TX 77018
Oak Forest-Garden Oaks NeighborhoodEstimated Value: $1,236,000 - $1,396,000
4
Beds
4
Baths
3,848
Sq Ft
$345/Sq Ft
Est. Value
About This Home
This home is located at 4307 Apollo St, Houston, TX 77018 and is currently estimated at $1,328,398, approximately $345 per square foot. 4307 Apollo St is a home located in Harris County with nearby schools including Durham Elementary School, Frank Black Middle School, and Waltrip High School.
Ownership History
Date
Name
Owned For
Owner Type
Purchase Details
Closed on
Jun 24, 2021
Sold by
Pmmp Ventures Llc
Bought by
Holcombe Thomas and Holcombe Kristilyn
Current Estimated Value
Home Financials for this Owner
Home Financials are based on the most recent Mortgage that was taken out on this home.
Original Mortgage
$879,200
Outstanding Balance
$796,006
Interest Rate
2.9%
Mortgage Type
New Conventional
Estimated Equity
$532,392
Purchase Details
Closed on
Mar 4, 2020
Sold by
Ahn Song and Ahn Yun J
Bought by
Pmmp Ventures Llc
Purchase Details
Closed on
Jul 6, 1995
Sold by
Thomas Kelvin Tracy and Thomas Kathleen Ann
Bought by
Ahn Song and Ahn Yun J
Home Financials for this Owner
Home Financials are based on the most recent Mortgage that was taken out on this home.
Original Mortgage
$57,600
Interest Rate
7.65%
Create a Home Valuation Report for This Property
The Home Valuation Report is an in-depth analysis detailing your home's value as well as a comparison with similar homes in the area
Home Values in the Area
Average Home Value in this Area
Purchase History
| Date | Buyer | Sale Price | Title Company |
|---|---|---|---|
| Holcombe Thomas | -- | Fair Texas Title | |
| Pmmp Ventures Llc | -- | Old Republic Title Ins Co | |
| Ahn Song | -- | -- |
Source: Public Records
Mortgage History
| Date | Status | Borrower | Loan Amount |
|---|---|---|---|
| Open | Holcombe Thomas | $879,200 | |
| Previous Owner | Ahn Song | $57,600 |
Source: Public Records
Tax History
| Year | Tax Paid | Tax Assessment Tax Assessment Total Assessment is a certain percentage of the fair market value that is determined by local assessors to be the total taxable value of land and additions on the property. | Land | Improvement |
|---|---|---|---|---|
| 2025 | $21,877 | $1,242,644 | $440,640 | $802,004 |
| 2024 | $21,877 | $1,412,468 | $403,920 | $1,008,548 |
| 2023 | $21,877 | $1,333,827 | $381,888 | $951,939 |
| 2022 | $24,685 | $1,121,070 | $381,888 | $739,182 |
| 2021 | $24,156 | $1,036,423 | $352,512 | $683,911 |
| 2020 | $8,224 | $339,623 | $308,448 | $31,175 |
| 2019 | $8,616 | $340,489 | $308,448 | $32,041 |
| 2018 | $8,467 | $334,598 | $298,998 | $35,600 |
| 2017 | $8,461 | $334,598 | $298,998 | $35,600 |
| 2016 | $8,461 | $334,598 | $298,998 | $35,600 |
| 2015 | $6,538 | $304,883 | $249,165 | $55,718 |
| 2014 | $6,538 | $254,349 | $213,570 | $40,779 |
Source: Public Records
Map
Nearby Homes
- 4314 Apollo St
- 4423 Apollo St
- 1062 Lamonte Ln
- 1154 Chamboard Ln
- 1550 Sue Barnett Dr
- 4105 Ella Blvd
- 1224 Thornton Rd
- 1046 Gardenia Dr
- 1306 Curtin St
- 810 Glowing Dawn
- 1050 W 42nd St
- 4125 Apollo St
- 1211 Cheshire Ln
- 1014 Lamonte Ln
- 1119 Cheshire Ln
- 1014 Gardenia Dr
- 1507 Sue Barnett Dr
- 1310 Chantilly Ln
- 1315 Gardenia Dr
- 1237 Althea Dr
- 4311 Apollo St
- 4303 Apollo St
- 4315 Apollo St
- 4306 Apollo St
- 1090 W 43rd St
- 4319 Apollo St
- 4255 Apollo St
- 4314 NE Apollo Run NE
- 1086 W 43rd St
- 4251 Apollo St
- 4323 Apollo St
- 4252 Apollo St
- 4330 Ella Blvd
- 1082 W 43rd St
- 4247 Apollo St
- 1587 Sue Barnett Dr
- 1090 Lamonte Ln
- 1083 W 43rd St
- 4334 Ella Blvd
- 1086 Lamonte Ln
Your Personal Tour Guide
Ask me questions while you tour the home.