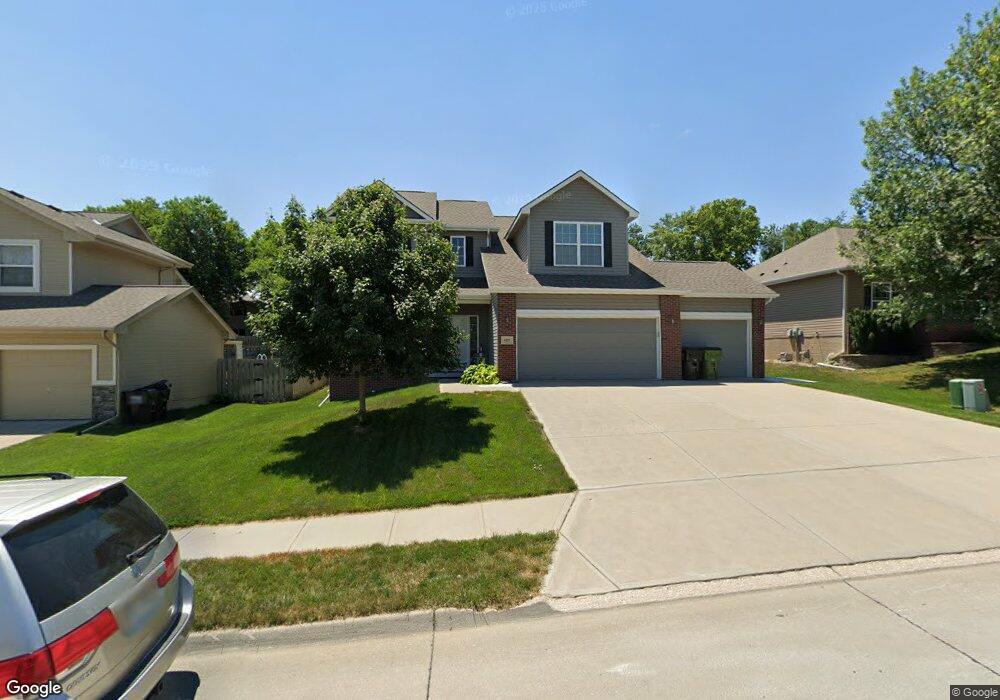
4307 Edgerton Dr Bellevue, NE 68123
Estimated Value: $378,380 - $419,000
4
Beds
4
Baths
2,364
Sq Ft
$172/Sq Ft
Est. Value
About This Home
This home is located at 4307 Edgerton Dr, Bellevue, NE 68123 and is currently estimated at $405,595, approximately $171 per square foot. 4307 Edgerton Dr is a home located in Sarpy County with nearby schools including Anderson Grove Elementary School, Papillion Middle School, and Papillion La Vista South High School.
Ownership History
Date
Name
Owned For
Owner Type
Purchase Details
Closed on
Aug 30, 2018
Sold by
Vance Douglas W
Bought by
Vance Angela W
Current Estimated Value
Purchase Details
Closed on
Jun 25, 2010
Sold by
Charleston Homes Llc
Bought by
Vance Douglas W and Vance Angela W
Home Financials for this Owner
Home Financials are based on the most recent Mortgage that was taken out on this home.
Original Mortgage
$225,050
Outstanding Balance
$149,640
Interest Rate
4.81%
Mortgage Type
VA
Estimated Equity
$255,955
Purchase Details
Closed on
Feb 10, 2010
Sold by
Great Western Bank
Bought by
Charleston Homes Llc
Home Financials for this Owner
Home Financials are based on the most recent Mortgage that was taken out on this home.
Original Mortgage
$152,840
Interest Rate
5.11%
Create a Home Valuation Report for This Property
The Home Valuation Report is an in-depth analysis detailing your home's value as well as a comparison with similar homes in the area
Home Values in the Area
Average Home Value in this Area
Purchase History
| Date | Buyer | Sale Price | Title Company |
|---|---|---|---|
| Vance Angela W | -- | None Available | |
| Vance Douglas W | $221,000 | Fat | |
| Charleston Homes Llc | $30,000 | Fat |
Source: Public Records
Mortgage History
| Date | Status | Borrower | Loan Amount |
|---|---|---|---|
| Open | Vance Douglas W | $225,050 | |
| Closed | Charleston Homes Llc | $152,840 |
Source: Public Records
Tax History
| Year | Tax Paid | Tax Assessment Tax Assessment Total Assessment is a certain percentage of the fair market value that is determined by local assessors to be the total taxable value of land and additions on the property. | Land | Improvement |
|---|---|---|---|---|
| 2025 | $6,122 | $349,238 | $61,000 | $288,238 |
| 2024 | $6,989 | $337,195 | $57,000 | $280,195 |
| 2023 | $6,989 | $317,010 | $50,000 | $267,010 |
| 2022 | $7,086 | $287,912 | $47,000 | $240,912 |
| 2021 | $7,082 | $281,495 | $47,000 | $234,495 |
| 2020 | $7,035 | $278,730 | $47,000 | $231,730 |
| 2019 | $6,878 | $264,238 | $44,000 | $220,238 |
| 2018 | $6,565 | $248,575 | $31,000 | $217,575 |
| 2017 | $6,084 | $224,006 | $31,000 | $193,006 |
| 2016 | $6,052 | $222,492 | $30,000 | $192,492 |
| 2015 | $5,782 | $212,406 | $30,000 | $182,406 |
| 2014 | $5,674 | $207,970 | $28,000 | $179,970 |
| 2012 | -- | $227,478 | $28,000 | $199,478 |
Source: Public Records
Map
Nearby Homes
- 4310 Mark St
- 4314 Mark St
- 11406 S 43rd St
- 4504 Mark St
- 11307 S 45th St
- 11318 S 47th St
- 11663 Trumble Loup E
- 4802 Lakeside Cir
- 11723 S 39th St
- 11601 S 37th St
- 3422 Nugget Cir
- 3429 Bline Ave
- 5401 Fenwick St
- 3415 Duane Ave
- 10700 Old 36th St Unit 10706
- 3302 E Dutchman Cir
- 11804 S 53rd St
- 12013 Daniell Rd
- 5410 Fenwick St
- 12015 S 44th St
- 4309 Edgerton Dr
- 4305 Edgerton Dr
- 4312 Mark St
- 4311 Edgerton Dr
- 4303 Edgerton Dr
- 4303 Edgerton Dr
- 4306 Edgerton Dr
- 4313 Edgerton Dr
- 4310 Edgerton Dr
- 4301 Edgerton Dr
- 4304 Edgerton Dr
- 4308 Mark St
- 4402 Mark St
- 4312 Edgerton Dr
- 4302 Edgerton Dr
- 4404 Mark St
- 4315 Edgerton Dr
- 4213 Edgerton Dr
- 11406 S 43rd Ave
- 4306 Mark St
Your Personal Tour Guide
Ask me questions while you tour the home.