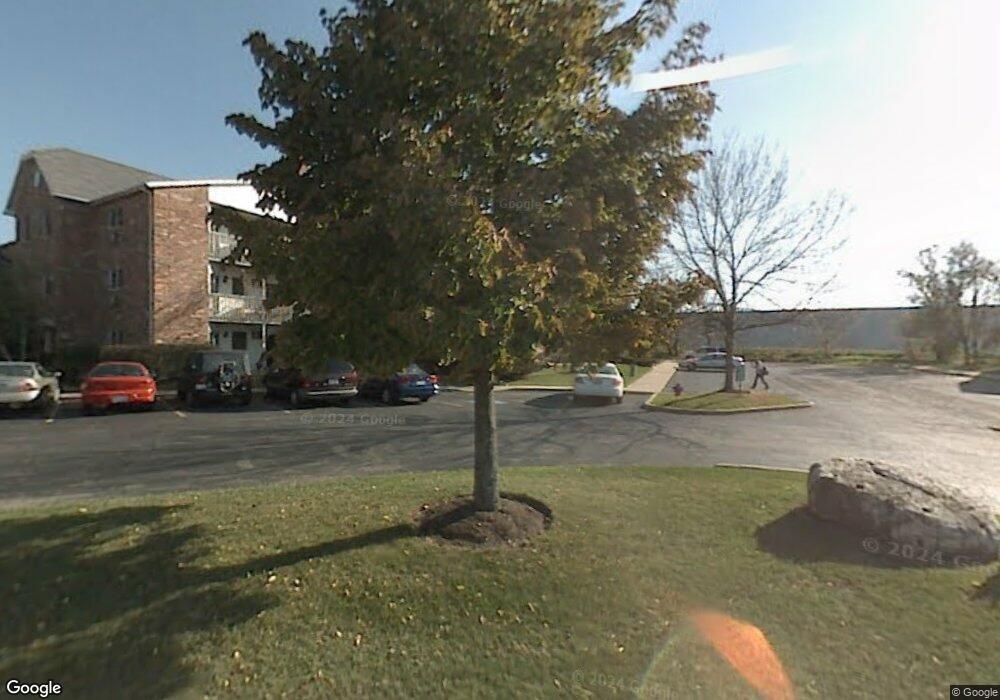
4307 W Shamrock Ln McHenry, IL 60050
Estimated Value: $149,000 - $193,000
1
Bed
3
Baths
875
Sq Ft
$184/Sq Ft
Est. Value
About This Home
This home is located at 4307 W Shamrock Ln, McHenry, IL 60050 and is currently estimated at $161,332, approximately $184 per square foot. 4307 W Shamrock Ln is a home located in McHenry County with nearby schools including Riverwood Elementary School, Parkland School, and McHenry Community High School - Upper Campus.
Ownership History
Date
Name
Owned For
Owner Type
Purchase Details
Closed on
Apr 22, 2013
Sold by
Kotiw David
Bought by
The Chicago Trust Company Na and Trust Number Sbl 3604
Current Estimated Value
Purchase Details
Closed on
Aug 28, 2012
Sold by
Aspiras Jose and Aspiras Nelia Q
Bought by
Kotiw David
Purchase Details
Closed on
Nov 19, 2004
Sold by
Aspiras Jose and Aspiras Nelia O
Bought by
Aspiras Jose and Aspiras Nelia Q
Home Financials for this Owner
Home Financials are based on the most recent Mortgage that was taken out on this home.
Original Mortgage
$69,199
Interest Rate
5.84%
Mortgage Type
FHA
Purchase Details
Closed on
Dec 28, 1994
Sold by
Mchenry State Bank
Bought by
Aspiras Jose and Aspiras Nelia O
Home Financials for this Owner
Home Financials are based on the most recent Mortgage that was taken out on this home.
Original Mortgage
$84,300
Interest Rate
9.27%
Mortgage Type
FHA
Create a Home Valuation Report for This Property
The Home Valuation Report is an in-depth analysis detailing your home's value as well as a comparison with similar homes in the area
Home Values in the Area
Average Home Value in this Area
Purchase History
| Date | Buyer | Sale Price | Title Company |
|---|---|---|---|
| The Chicago Trust Company Na | -- | None Available | |
| Kotiw David | $35,000 | Fidelity Natl Title | |
| Aspiras Jose | -- | Transcontinental Title Co | |
| Aspiras Jose | $87,000 | Chicago Title |
Source: Public Records
Mortgage History
| Date | Status | Borrower | Loan Amount |
|---|---|---|---|
| Open | Chicago Trust Company Na | $75,000 | |
| Closed | The Chicago Trust Company Na | $245,000 | |
| Previous Owner | Aspiras Jose | $445,275 | |
| Previous Owner | Aspiras Jose | $69,199 | |
| Previous Owner | Aspiras Jose | $84,300 |
Source: Public Records
Tax History Compared to Growth
Tax History
| Year | Tax Paid | Tax Assessment Tax Assessment Total Assessment is a certain percentage of the fair market value that is determined by local assessors to be the total taxable value of land and additions on the property. | Land | Improvement |
|---|---|---|---|---|
| 2024 | $3,001 | $35,657 | $3,480 | $32,177 |
| 2023 | $2,943 | $31,977 | $3,121 | $28,856 |
| 2022 | $2,687 | $28,342 | $2,766 | $25,576 |
| 2021 | $2,597 | $26,572 | $2,593 | $23,979 |
| 2020 | $2,580 | $25,775 | $2,515 | $23,260 |
| 2019 | $2,526 | $24,505 | $2,391 | $22,114 |
| 2018 | $1,916 | $16,745 | $1,941 | $14,804 |
| 2017 | $1,892 | $16,043 | $1,860 | $14,183 |
| 2016 | $1,873 | $15,307 | $1,775 | $13,532 |
| 2013 | -- | $11,722 | $1,689 | $10,033 |
Source: Public Records
Map
Nearby Homes
- 4305 W Shamrock Ln Unit 2B
- 4301 W Shamrock Ln Unit 1C
- 4314 W Shamrock Ln Unit 2D
- 4312 W Shamrock Ln Unit 3A
- Lot 48-53 Ridgeview Dr
- 0 Route 31 Rd Unit 10923359
- 702 S Il Route 31
- 3721 Brighton Place
- 1100 S Illinois Route 31
- 1510 S Illinois Route 31
- 1110 S Green St
- 416 Kresswood Dr Unit D
- 3510 Vine St
- 0000 Veterans Pkwy
- 4231 Savoy Ln
- 1015 Bonita Ln
- 0000 Bull Valley Rd
- 2002 S Illinois Route 31
- 2122 Concord Dr Unit 3
- 2201 Concord Dr
- 4301 W Shamrock Ln
- 4307 W Shamrock Ln
- 4307 W Shamrock Ln
- 4305 W Shamrock Ln
- 4301 W Shamrock Ln
- 4301 W Shamrock Ln
- 4307 W Shamrock Ln
- 4307 W Shamrock Ln
- 4307 W Shamrock Ln
- 4305 W Shamrock Ln
- 4301 W Shamrock Ln
- 4305 W Shamrock Ln
- 4305 W Shamrock Ln
- 4301 W Shamrock Ln Unit 3B
- 4307 W Shamrock Ln Unit 1D
- 4301 W Shamrock Ln Unit 2D
- 4307 W Shamrock Ln
- 4305 W Shamrock Ln Unit 2A
- 4301 W Shamrock Ln Unit 2B
- 4301 W Shamrock Ln Unit 3A