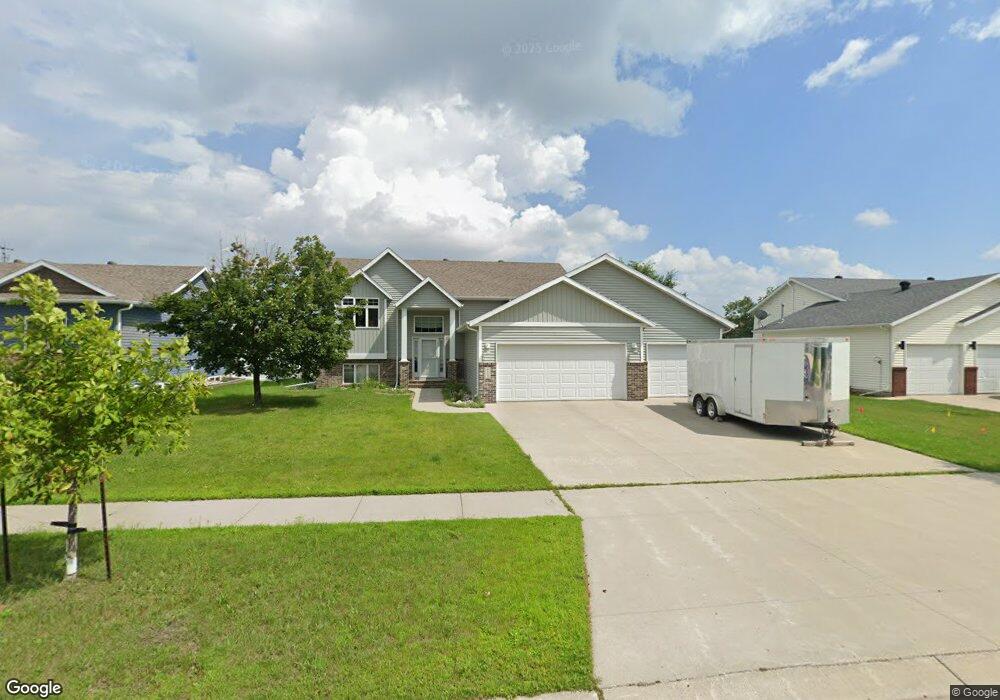
4308 53rd St S Fargo, ND 58104
Osgood NeighborhoodEstimated Value: $387,000 - $449,000
2
Beds
2
Baths
2,509
Sq Ft
$171/Sq Ft
Est. Value
About This Home
This home is located at 4308 53rd St S, Fargo, ND 58104 and is currently estimated at $428,292, approximately $170 per square foot. 4308 53rd St S is a home located in Cass County with nearby schools including Osgood Elementary School, Liberty Middle School, and West Fargo Sheyenne High School.
Ownership History
Date
Name
Owned For
Owner Type
Purchase Details
Closed on
Oct 14, 2019
Sold by
Reese Jeffrey F and Estate Luverne Kiene
Bought by
Lee Cory
Current Estimated Value
Purchase Details
Closed on
Feb 5, 2008
Sold by
Kiene Luverne
Bought by
Kiene Luverne
Purchase Details
Closed on
Dec 14, 2007
Sold by
Pebble Creek Homes Inc
Bought by
Kiene Luverne
Create a Home Valuation Report for This Property
The Home Valuation Report is an in-depth analysis detailing your home's value as well as a comparison with similar homes in the area
Home Values in the Area
Average Home Value in this Area
Purchase History
| Date | Buyer | Sale Price | Title Company |
|---|---|---|---|
| Lee Cory | -- | None Available | |
| Kiene Luverne | -- | -- | |
| Kiene Luverne | -- | -- |
Source: Public Records
Tax History Compared to Growth
Tax History
| Year | Tax Paid | Tax Assessment Tax Assessment Total Assessment is a certain percentage of the fair market value that is determined by local assessors to be the total taxable value of land and additions on the property. | Land | Improvement |
|---|---|---|---|---|
| 2024 | $6,927 | $207,650 | $36,950 | $170,700 |
| 2023 | $6,492 | $192,000 | $38,800 | $153,200 |
| 2022 | $6,375 | $179,450 | $38,800 | $140,650 |
| 2021 | $5,907 | $159,500 | $38,800 | $120,700 |
| 2020 | $5,713 | $154,850 | $38,800 | $116,050 |
| 2019 | $5,687 | $154,850 | $24,250 | $130,600 |
| 2018 | $5,577 | $154,850 | $24,250 | $130,600 |
| 2017 | $5,376 | $150,500 | $24,250 | $126,250 |
| 2016 | $4,841 | $136,800 | $24,250 | $112,550 |
| 2015 | $4,808 | $136,800 | $16,500 | $120,300 |
| 2014 | $4,720 | $127,900 | $16,500 | $111,400 |
| 2013 | $4,671 | $119,550 | $16,500 | $103,050 |
Source: Public Records
Map
Nearby Homes
- 4272 51st St S
- 4281 Estate Dr S
- 4127 52nd St S
- 4110 52nd St S
- 9350 & 9124 57th St S
- 4758 Townsite Place S
- 4723 Clock Tower Ln S
- 4775 Townsite Place S
- 4450 48th St S
- 5466 Justice Dr S
- 4856 48th Ave S
- 5861 Wildflower Dr S
- 3676 Crimson Loop S
- 3712 49th St S
- 4891 Foxtail Ln S
- 6023 Wildflower Dr S
- 4868 Bluebell Loop S
- 6090 Wildflower Dr S
- 4824 Decorah Way S
- 4849 Decorah Way S