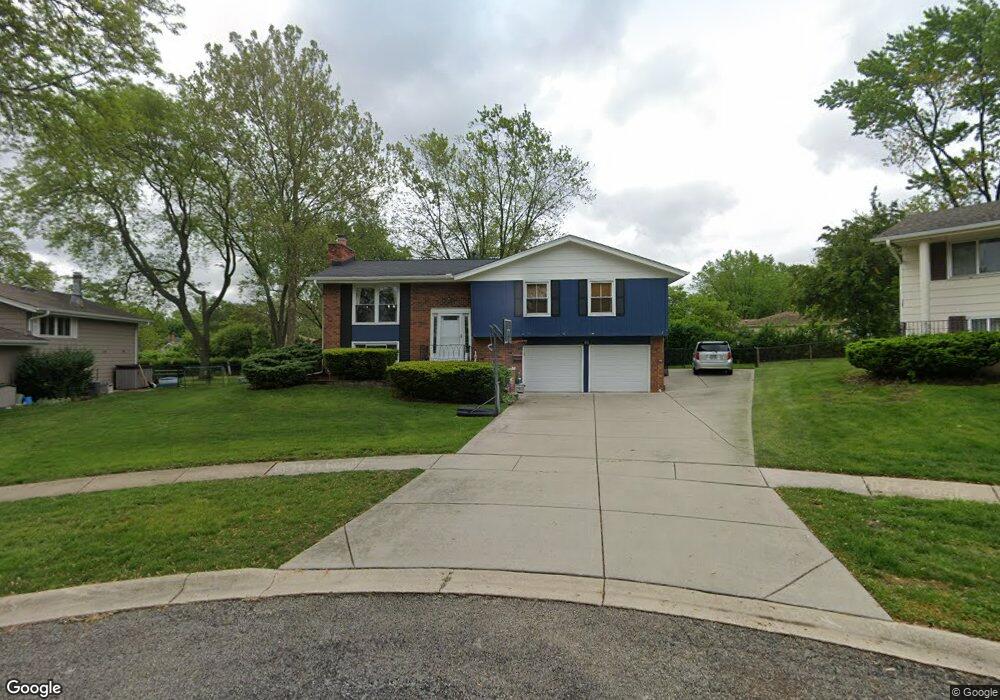
431 Chestnut Ct Schaumburg, IL 60193
South Schaumburg NeighborhoodEstimated Value: $409,000 - $483,000
4
Beds
3
Baths
1,470
Sq Ft
$302/Sq Ft
Est. Value
About This Home
This home is located at 431 Chestnut Ct, Schaumburg, IL 60193 and is currently estimated at $443,374, approximately $301 per square foot. 431 Chestnut Ct is a home located in Cook County with nearby schools including Thomas Dooley Elementary School, Jane Addams Junior High School, and Schaumburg High School.
Ownership History
Date
Name
Owned For
Owner Type
Purchase Details
Closed on
Apr 20, 1999
Sold by
Monroe Nanci A and Monroe Edward
Bought by
Snow Sean D and Snow Joy
Current Estimated Value
Home Financials for this Owner
Home Financials are based on the most recent Mortgage that was taken out on this home.
Original Mortgage
$185,000
Outstanding Balance
$47,352
Interest Rate
7.17%
Estimated Equity
$396,022
Purchase Details
Closed on
Aug 14, 1995
Sold by
Streu Nanci A
Bought by
Streu Nanci A and Monroe Edward
Home Financials for this Owner
Home Financials are based on the most recent Mortgage that was taken out on this home.
Original Mortgage
$141,600
Interest Rate
7.43%
Purchase Details
Closed on
Aug 11, 1995
Sold by
Reutenauer Thomas A and Reutenauer Ann M
Bought by
Streu Nanci A
Home Financials for this Owner
Home Financials are based on the most recent Mortgage that was taken out on this home.
Original Mortgage
$141,600
Interest Rate
7.43%
Create a Home Valuation Report for This Property
The Home Valuation Report is an in-depth analysis detailing your home's value as well as a comparison with similar homes in the area
Home Values in the Area
Average Home Value in this Area
Purchase History
| Date | Buyer | Sale Price | Title Company |
|---|---|---|---|
| Snow Sean D | $220,000 | First American Title | |
| Streu Nanci A | -- | -- | |
| Streu Nanci A | $177,000 | -- |
Source: Public Records
Mortgage History
| Date | Status | Borrower | Loan Amount |
|---|---|---|---|
| Open | Snow Sean D | $185,000 | |
| Previous Owner | Streu Nanci A | $141,600 |
Source: Public Records
Tax History Compared to Growth
Tax History
| Year | Tax Paid | Tax Assessment Tax Assessment Total Assessment is a certain percentage of the fair market value that is determined by local assessors to be the total taxable value of land and additions on the property. | Land | Improvement |
|---|---|---|---|---|
| 2024 | $7,635 | $30,573 | $6,024 | $24,549 |
| 2023 | $7,376 | $30,573 | $6,024 | $24,549 |
| 2022 | $7,376 | $30,573 | $6,024 | $24,549 |
| 2021 | $6,140 | $23,589 | $4,087 | $19,502 |
| 2020 | $6,102 | $23,589 | $4,087 | $19,502 |
| 2019 | $6,185 | $26,505 | $4,087 | $22,418 |
| 2018 | $6,331 | $24,531 | $3,657 | $20,874 |
| 2017 | $6,249 | $24,531 | $3,657 | $20,874 |
| 2016 | $6,086 | $24,531 | $3,657 | $20,874 |
| 2015 | $5,559 | $21,205 | $3,227 | $17,978 |
| 2014 | $5,514 | $21,205 | $3,227 | $17,978 |
| 2013 | $5,355 | $21,205 | $3,227 | $17,978 |
Source: Public Records
Map
Nearby Homes
- 1027 Duxbury Ln
- 305 Williams Dr
- 1403 Hampton Ln
- 908 Jeffery Ct
- 521 Auburn Ln
- 818 Brentwood Ct
- 519 S Springinsguth Rd
- 1125 Charlene Ln
- 1321 Yarmouth Ct Unit 662
- 988 Chelsea Ln
- 220 Kemah Ln
- 702 Auburn Cir
- 1008 Shannock Ln
- 124 Westover Ln
- 412 Redwood Ln
- 231 Webster Ln
- 1530 Syracuse Ln
- 1313 Hartmann Dr
- 1104 Taunton Ct
- 104 N Braintree Dr
- 429 Chestnut Ct Unit 14
- 1126 Bradford Ln
- 433 Chestnut Ct
- 1122 Bradford Ln
- 1130 Bradford Ln
- 1113 W Weathersfield Way
- 1116 Bradford Ln Unit 5
- 1119 W Weathersfield Way
- 432 Chestnut Ct
- 1134 Bradford Ln
- 426 Chestnut Ct
- 1112 Bradford Ln
- 430 Chestnut Ct
- 1109 W Weathersfield Way
- 424 Chestnut Ct
- 1136 Bradford Ln
- 1108 Bradford Ln
- 433 S Braintree Dr
- 437 S Braintree Dr
- 429 S Braintree Dr