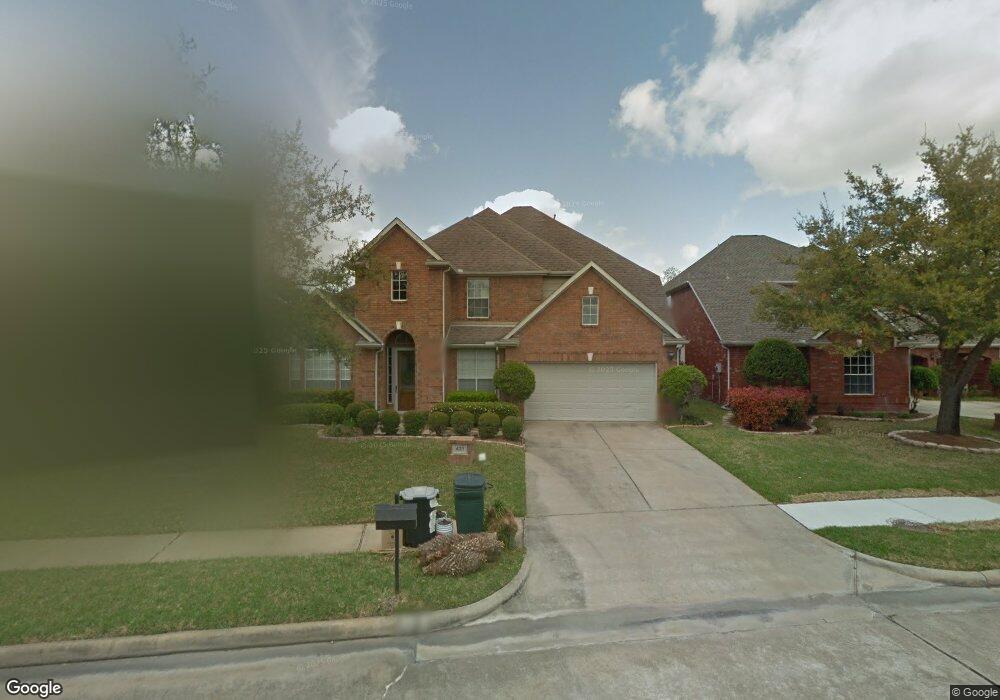
431 Dockside Ct Sugar Land, TX 77478
Sugar Creek NeighborhoodEstimated Value: $631,868 - $742,000
3
Beds
2
Baths
3,222
Sq Ft
$213/Sq Ft
Est. Value
About This Home
This home is located at 431 Dockside Ct, Sugar Land, TX 77478 and is currently estimated at $684,967, approximately $212 per square foot. 431 Dockside Ct is a home located in Fort Bend County with nearby schools including Highlands Elementary School, Dulles Middle School, and Dulles High School.
Ownership History
Date
Name
Owned For
Owner Type
Purchase Details
Closed on
Aug 15, 1996
Sold by
Monarch Developments Of Texas Inc
Bought by
Ma Cau Theu
Current Estimated Value
Home Financials for this Owner
Home Financials are based on the most recent Mortgage that was taken out on this home.
Original Mortgage
$207,000
Outstanding Balance
$16,276
Interest Rate
8.15%
Estimated Equity
$668,691
Create a Home Valuation Report for This Property
The Home Valuation Report is an in-depth analysis detailing your home's value as well as a comparison with similar homes in the area
Home Values in the Area
Average Home Value in this Area
Purchase History
| Date | Buyer | Sale Price | Title Company |
|---|---|---|---|
| Ma Cau Theu | -- | Stewart Title Co |
Source: Public Records
Mortgage History
| Date | Status | Borrower | Loan Amount |
|---|---|---|---|
| Open | Ma Cau Theu | $207,000 |
Source: Public Records
Tax History Compared to Growth
Tax History
| Year | Tax Paid | Tax Assessment Tax Assessment Total Assessment is a certain percentage of the fair market value that is determined by local assessors to be the total taxable value of land and additions on the property. | Land | Improvement |
|---|---|---|---|---|
| 2025 | $8,263 | $626,284 | $162,500 | $475,963 |
| 2024 | $8,263 | $569,349 | $122,661 | $446,688 |
| 2023 | $7,488 | $517,590 | $125,000 | $392,590 |
| 2022 | $9,606 | $559,830 | $88,140 | $471,690 |
| 2021 | $10,227 | $508,940 | $125,000 | $383,940 |
| 2020 | $10,101 | $497,590 | $125,000 | $372,590 |
| 2019 | $10,533 | $501,190 | $125,000 | $376,190 |
| 2018 | $10,204 | $484,400 | $118,750 | $365,650 |
| 2017 | $10,037 | $471,240 | $118,750 | $352,490 |
| 2016 | $9,606 | $451,000 | $118,750 | $332,250 |
| 2015 | $7,945 | $410,000 | $118,750 | $291,250 |
| 2014 | $8,025 | $405,270 | $118,750 | $286,520 |
Source: Public Records
Map
Nearby Homes
- 422 Bay Bridge Dr
- 402 Bay Bridge Dr
- 611 Salerno St
- 403 Brook Shore Ct
- 423 Brook Shore Ct
- 711 Oyster Creek Dr
- 8230 Falling Water Ct
- 115 Capri St
- 310 Brook Forest Trail
- 512 Venice St
- 15903 Court St
- 919 Mockingbird Way
- 15618 Oyster Cove Dr
- 702 Piedmont St
- 1007 Oyster Bank Cir
- 1015 Old Oyster Trail
- 112 Dogwood St
- 15611 Oyster Cove Dr
- 902 Piedmont St
- 614 Kyle St
- 427 Dockside Ct
- 435 Dockside Ct
- 423 Dockside Ct
- 430 Dockside Ct
- 419 Dockside Ct
- 434 Dockside Ct
- 426 Dockside Ct
- 422 Dockside Ct
- 415 Dockside Ct
- 418 Dockside Ct
- 411 Dockside Ct
- 414 Dockside Ct
- 503 Savoy St
- 414 Bay Bridge Dr
- 418 Bay Bridge Dr
- 410 Bay Bridge Dr
- 406 Bay Bridge Dr
- 407 Dockside Ct
- 410 Dockside Ct
- 602 Salerno St
