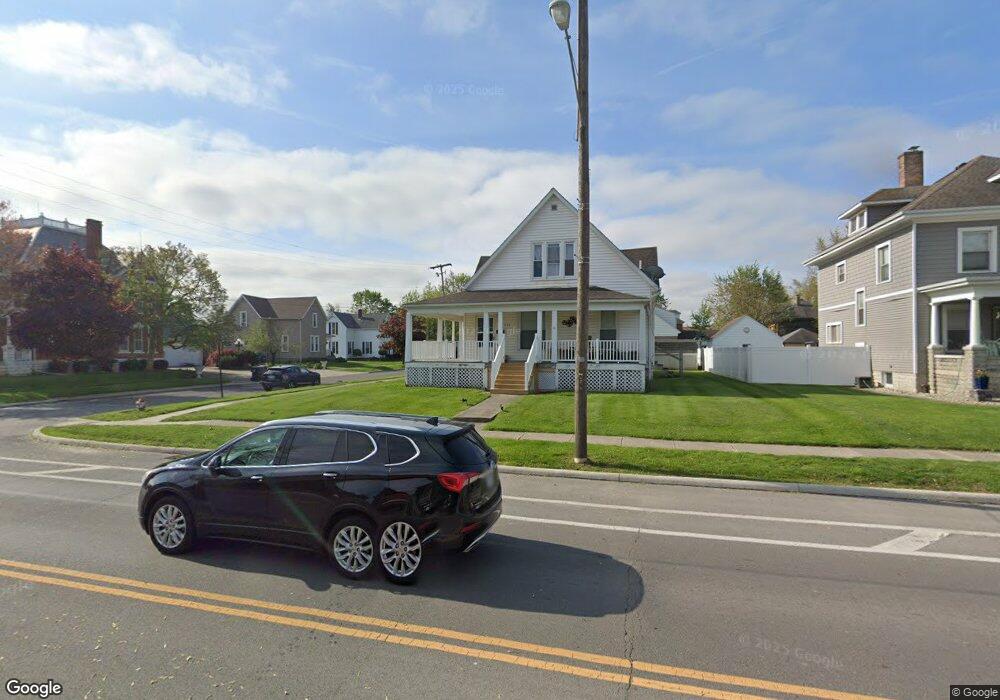
431 E 5th St Delphos, OH 45833
Estimated Value: $140,000 - $255,000
5
Beds
3
Baths
2,498
Sq Ft
$79/Sq Ft
Est. Value
About This Home
This home is located at 431 E 5th St, Delphos, OH 45833 and is currently estimated at $197,946, approximately $79 per square foot. 431 E 5th St is a home located in Allen County with nearby schools including Delphos St. John's High School and Delphos St. John's Elementary School.
Ownership History
Date
Name
Owned For
Owner Type
Purchase Details
Closed on
Apr 17, 2025
Sold by
Altenburger Michele L and Altenburger Brian J
Bought by
Bab 3G Llc
Current Estimated Value
Purchase Details
Closed on
Jan 13, 1997
Sold by
Waitman Myrna
Bought by
Mazur Gerald and Mazur Sonia
Purchase Details
Closed on
Apr 29, 1992
Bought by
Waitman Nancy A
Create a Home Valuation Report for This Property
The Home Valuation Report is an in-depth analysis detailing your home's value as well as a comparison with similar homes in the area
Home Values in the Area
Average Home Value in this Area
Purchase History
| Date | Buyer | Sale Price | Title Company |
|---|---|---|---|
| Bab 3G Llc | -- | None Listed On Document | |
| Altenburger Michele L | -- | None Listed On Document | |
| Mazur Gerald | $95,000 | -- | |
| Waitman Nancy A | -- | -- |
Source: Public Records
Mortgage History
| Date | Status | Borrower | Loan Amount |
|---|---|---|---|
| Closed | Mazur Gerald | -- |
Source: Public Records
Tax History Compared to Growth
Tax History
| Year | Tax Paid | Tax Assessment Tax Assessment Total Assessment is a certain percentage of the fair market value that is determined by local assessors to be the total taxable value of land and additions on the property. | Land | Improvement |
|---|---|---|---|---|
| 2024 | $1,774 | $56,040 | $7,180 | $48,860 |
| 2023 | $1,397 | $41,830 | $5,360 | $36,470 |
| 2022 | $1,431 | $41,830 | $5,360 | $36,470 |
| 2021 | $1,440 | $41,830 | $5,360 | $36,470 |
| 2020 | $1,207 | $36,750 | $5,110 | $31,640 |
| 2019 | $1,207 | $36,750 | $5,110 | $31,640 |
| 2018 | $1,184 | $36,750 | $5,110 | $31,640 |
| 2017 | $1,132 | $33,880 | $5,110 | $28,770 |
| 2016 | $1,145 | $33,880 | $5,110 | $28,770 |
| 2015 | $1,334 | $33,880 | $5,110 | $28,770 |
| 2014 | $1,334 | $39,270 | $4,900 | $34,370 |
| 2013 | $1,340 | $39,270 | $4,900 | $34,370 |
Source: Public Records
Map
Nearby Homes
- 405 N Franklin St
- 610 N Washington St
- 810 N Franklin St
- 629 N Main St
- 332 W 6th St
- 633 N Clay St
- 221 S Main St
- 409 N Bredeick St
- 424 S Canal St
- 483 S Franklin St
- 709 W 4th St
- 420 S Cass St
- 1000 Colettas Way
- 7110 Elida Rd
- 1400 S Clay St Unit 17
- 8448 Elida Rd
- 4455 N Kill Rd
- 26267 Road R
- 0 Heritage Cir Unit 6112034
- 0 Heritage Cir Unit 303239