Estimated Value: $290,000 - $310,000
3
Beds
2
Baths
1,389
Sq Ft
$216/Sq Ft
Est. Value
About This Home
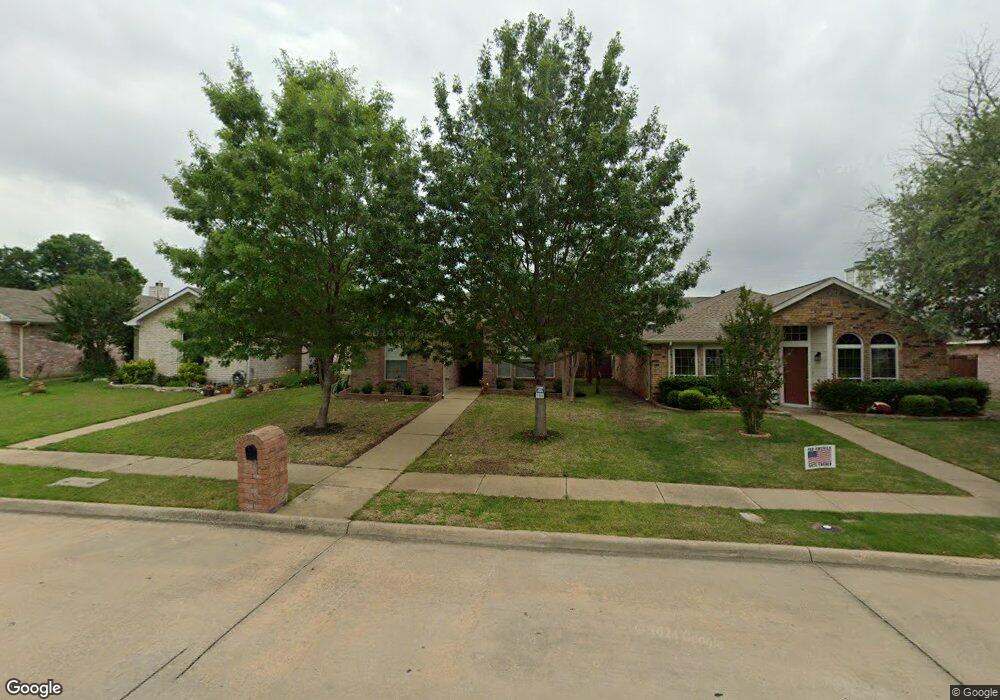
This home is located at 431 Fleming St, Wylie, TX 75098 and is currently estimated at $300,156, approximately $216 per square foot. 431 Fleming St is a home located in Collin County with nearby schools including T.F. Birmingham Elementary School, Frank Mcmillan Junior High School, and Davis Intermediate School.
Ownership History
Date
Name
Owned For
Owner Type
Purchase Details
Closed on
Jul 6, 1998
Sold by
Choice Homes Texas Inc
Bought by
Pisquiy Juan F and Pisquiy Delia E
Current Estimated Value
Home Financials for this Owner
Home Financials are based on the most recent Mortgage that was taken out on this home.
Original Mortgage
$78,834
Outstanding Balance
$16,259
Interest Rate
7.09%
Mortgage Type
FHA
Estimated Equity
$283,897
Purchase Details
Closed on
Jan 14, 1998
Sold by
Larry J Hendricks Inc
Bought by
Choice Homes Texas Inc
Home Financials for this Owner
Home Financials are based on the most recent Mortgage that was taken out on this home.
Original Mortgage
$6,500,000
Interest Rate
7.13%
Create a Home Valuation Report for This Property
The Home Valuation Report is an in-depth analysis detailing your home's value as well as a comparison with similar homes in the area
Home Values in the Area
Average Home Value in this Area
Purchase History
| Date | Buyer | Sale Price | Title Company |
|---|---|---|---|
| Pisquiy Juan F | -- | -- | |
| Choice Homes Texas Inc | -- | -- |
Source: Public Records
Mortgage History
| Date | Status | Borrower | Loan Amount |
|---|---|---|---|
| Open | Pisquiy Juan F | $78,834 | |
| Previous Owner | Choice Homes Texas Inc | $6,500,000 |
Source: Public Records
Tax History Compared to Growth
Tax History
| Year | Tax Paid | Tax Assessment Tax Assessment Total Assessment is a certain percentage of the fair market value that is determined by local assessors to be the total taxable value of land and additions on the property. | Land | Improvement |
|---|---|---|---|---|
| 2025 | $1,678 | $260,057 | $90,000 | $170,057 |
| 2024 | $1,678 | $256,735 | $68,850 | $189,813 |
| 2023 | $1,678 | $233,395 | $68,850 | $192,514 |
| 2022 | $4,655 | $212,177 | $71,250 | $174,534 |
| 2021 | $4,538 | $195,213 | $57,000 | $138,213 |
| 2020 | $4,354 | $192,369 | $40,375 | $151,994 |
| 2019 | $4,189 | $159,412 | $40,375 | $151,540 |
| 2018 | $3,903 | $144,920 | $40,375 | $144,827 |
| 2017 | $3,548 | $165,479 | $40,375 | $125,104 |
| 2016 | $3,328 | $137,627 | $28,263 | $109,364 |
| 2015 | $2,549 | $124,044 | $24,225 | $99,819 |
Source: Public Records
Map
Nearby Homes
- 300 S Cottonbelt Ave Unit 3A
- 420 W Oak St
- 205 S Cottonbelt Ave
- 310 Austin Ave
- 107 N Winding Oaks Dr
- 314 Stephanie St
- 111 N Keefer Dr
- 404 W Jefferson St
- 315 Celia Cir
- 804 Memorial Dr
- 307 W Brown St
- 115 Pullman Place
- 708 Andersonville Ln
- 903 Mardi Gras Ln
- 309 Sikorsky Ct
- 702 S Ballard Ave
- 205 Stone Cir
- 329 S 2nd St
- 416 S 1st St
- 301 S 3rd St