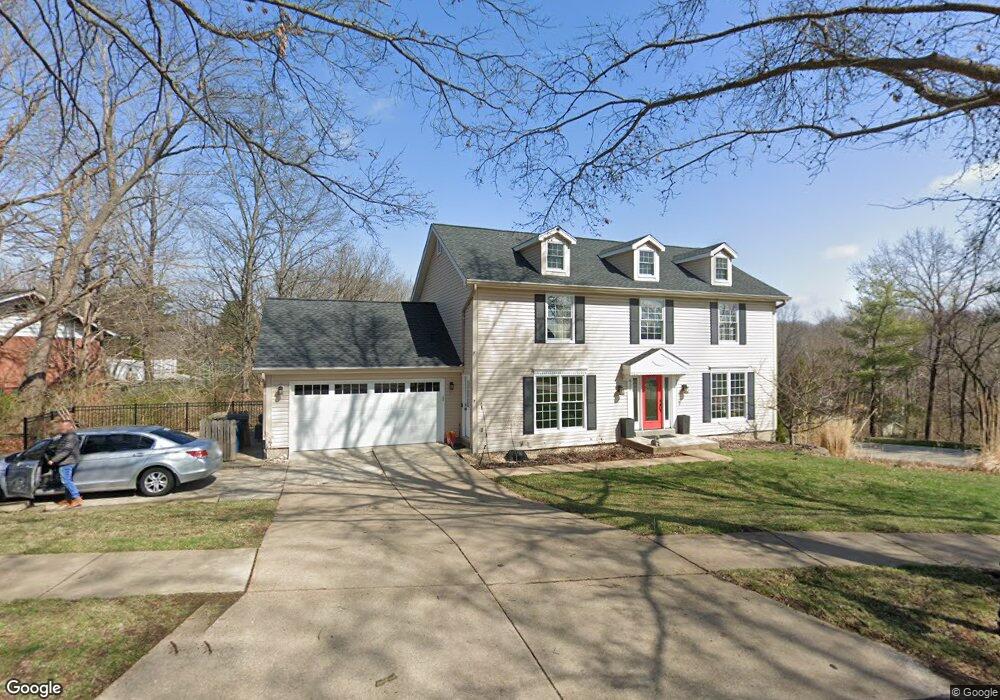
431 Forsheer Dr Chesterfield, MO 63017
Estimated Value: $619,000 - $730,000
4
Beds
4
Baths
2,784
Sq Ft
$239/Sq Ft
Est. Value
About This Home
This home is located at 431 Forsheer Dr, Chesterfield, MO 63017 and is currently estimated at $665,710, approximately $239 per square foot. 431 Forsheer Dr is a home located in St. Louis County with nearby schools including Claymont Elementary School, Parkway West Middle School, and Parkway West High School.
Ownership History
Date
Name
Owned For
Owner Type
Purchase Details
Closed on
Oct 3, 2013
Sold by
Rands Elizabeth A and Barnes Jeffrey James
Bought by
Shank Charles J and Morelli Leslie K
Current Estimated Value
Home Financials for this Owner
Home Financials are based on the most recent Mortgage that was taken out on this home.
Original Mortgage
$287,000
Outstanding Balance
$216,659
Interest Rate
4.62%
Mortgage Type
New Conventional
Estimated Equity
$449,051
Purchase Details
Closed on
Jun 8, 2011
Sold by
Rands Matthew T and Rands Elizabeth A
Bought by
Rands Elizabeth A
Purchase Details
Closed on
Dec 8, 2008
Sold by
Rands Matthew Todd and Rands Elizabeth Ann
Bought by
Rands Matthew T and Rands Elizabeth A
Purchase Details
Closed on
Dec 15, 2004
Sold by
Hintze Paul F and Hintze Patricia A
Bought by
Rands Matthew Todd and Rands Elizabeth Ann
Home Financials for this Owner
Home Financials are based on the most recent Mortgage that was taken out on this home.
Original Mortgage
$333,700
Interest Rate
5.7%
Mortgage Type
Purchase Money Mortgage
Create a Home Valuation Report for This Property
The Home Valuation Report is an in-depth analysis detailing your home's value as well as a comparison with similar homes in the area
Home Values in the Area
Average Home Value in this Area
Purchase History
| Date | Buyer | Sale Price | Title Company |
|---|---|---|---|
| Shank Charles J | $360,000 | Investors Title Co Clayton | |
| Rands Elizabeth A | -- | None Available | |
| Rands Matthew T | -- | None Available | |
| Rands Matthew Todd | $420,500 | -- |
Source: Public Records
Mortgage History
| Date | Status | Borrower | Loan Amount |
|---|---|---|---|
| Open | Shank Charles J | $287,000 | |
| Previous Owner | Rands Matthew Todd | $333,700 | |
| Closed | Rands Matthew Todd | $42,050 |
Source: Public Records
Tax History Compared to Growth
Tax History
| Year | Tax Paid | Tax Assessment Tax Assessment Total Assessment is a certain percentage of the fair market value that is determined by local assessors to be the total taxable value of land and additions on the property. | Land | Improvement |
|---|---|---|---|---|
| 2025 | $6,041 | $96,630 | $38,720 | $57,910 |
| 2024 | $6,041 | $93,420 | $34,410 | $59,010 |
| 2023 | $6,041 | $93,420 | $34,410 | $59,010 |
| 2022 | $5,414 | $77,160 | $30,120 | $47,040 |
| 2021 | $5,382 | $77,160 | $30,120 | $47,040 |
| 2020 | $4,974 | $67,540 | $25,820 | $41,720 |
| 2019 | $4,917 | $67,540 | $25,820 | $41,720 |
| 2018 | $5,006 | $63,800 | $21,510 | $42,290 |
| 2017 | $4,863 | $63,800 | $21,510 | $42,290 |
| 2016 | $5,151 | $64,320 | $13,150 | $51,170 |
| 2015 | $5,394 | $64,320 | $13,150 | $51,170 |
| 2014 | $5,410 | $68,690 | $10,300 | $58,390 |
Source: Public Records
Map
Nearby Homes
- 2387 Baxton Way
- 612 Corley Ct
- 2323 Manor Grove Dr Unit 4
- 2335 Manor Grove Dr Unit 9
- 2314 Manor Grove Dr Unit 3
- 15047 Green Circle Dr
- 15009 Claymoor Ct Unit 15
- 15009 Claymoor Ct Unit 11
- 15038 Claymoor Ct Unit 3
- 15038 Claymoor Ct Unit 2
- 2452 Claymoor Dr
- 418 Tamarack Dr
- 509 Antioch Ln
- 770 Straub Rd
- 15371 Timber Hill Ln
- 246 Cedar Trail Dr
- 449 Wildwood Pkwy
- 15248 Clayton Rd
- 258 Meadowbrook Country Club Estate
- 15464 Country Ridge Dr
- 435 Forsheer Dr
- 704 Forsheer Ct
- 432 Forsheer Dr
- 421 Forsheer Dr
- 437 Forsheer Dr
- 436 Forsheer Dr
- 428 Forsheer Dr
- 708 Forsheer Ct
- 1707 Millstream Dr
- 417 Forsheer Dr
- 420 Forsheer Dr
- 439 Forsheer Dr
- 440 Forsheer Dr
- 712 Forsheer Ct
- 413 Forsheer Dr
- 622 Packford Dr
- 442 Forsheer Dr
- 409 Forsheer Dr
- 715 Forsheer Ct
- 441 Forsheer Dr