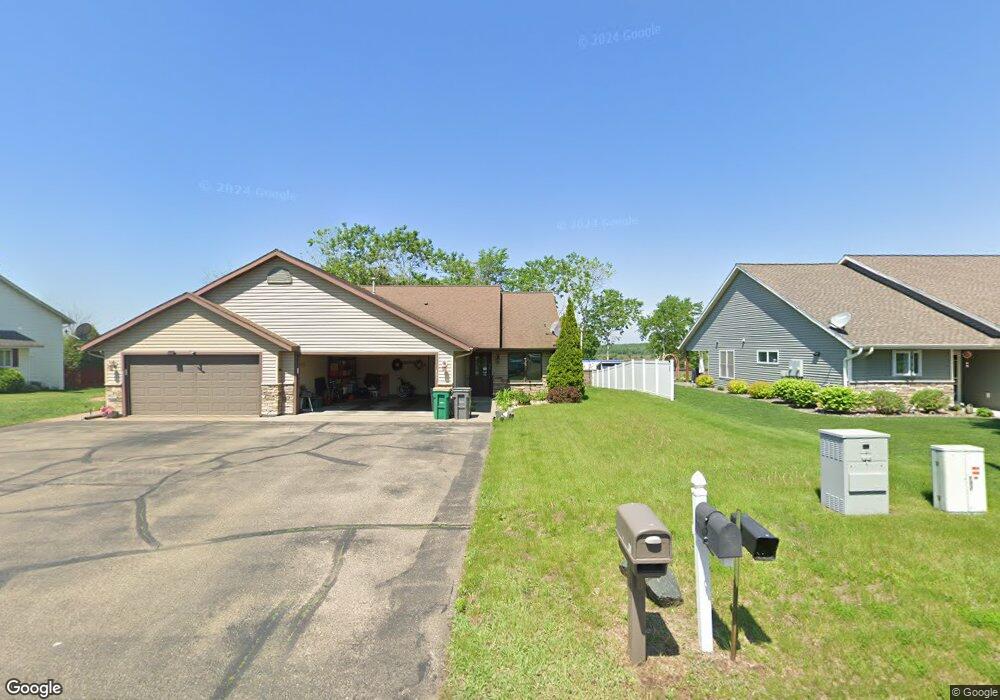
431 Garfield St Dresser, WI 54009
Estimated Value: $282,428 - $304,000
3
Beds
2
Baths
1,584
Sq Ft
$185/Sq Ft
Est. Value
About This Home
This home is located at 431 Garfield St, Dresser, WI 54009 and is currently estimated at $293,607, approximately $185 per square foot. 431 Garfield St is a home located in Polk County with nearby schools including Dresser Elementary School, Saint Croix Falls Elementary School, and Saint Croix Falls Middle School.
Ownership History
Date
Name
Owned For
Owner Type
Purchase Details
Closed on
Apr 7, 2021
Sold by
Terranova Carolyn
Bought by
Sandra Terranova Supplemental Needs Trus
Current Estimated Value
Purchase Details
Closed on
Nov 4, 2020
Sold by
Glaser Karen
Bought by
Terranova Carolyn
Purchase Details
Closed on
Jun 5, 2019
Sold by
Gregory Matthew J and Gregory Kristine R
Bought by
Kiedrowski Gary M
Home Financials for this Owner
Home Financials are based on the most recent Mortgage that was taken out on this home.
Original Mortgage
$240,000
Interest Rate
4.01%
Mortgage Type
Reverse Mortgage Home Equity Conversion Mortgage
Purchase Details
Closed on
Mar 30, 2007
Sold by
Demulling Richard P
Bought by
Skinner Kristine R
Purchase Details
Closed on
Aug 2, 2006
Sold by
Cabreana Daniel J
Bought by
Demulling Richard P
Create a Home Valuation Report for This Property
The Home Valuation Report is an in-depth analysis detailing your home's value as well as a comparison with similar homes in the area
Home Values in the Area
Average Home Value in this Area
Purchase History
| Date | Buyer | Sale Price | Title Company |
|---|---|---|---|
| Sandra Terranova Supplemental Needs Trus | -- | None Available | |
| Terranova Carolyn | $180,000 | Partners Title | |
| Kiedrowski Gary M | $160,000 | Polk County Abstract | |
| Skinner Kristine R | $130,000 | -- | |
| Demulling Richard P | $17,500 | -- |
Source: Public Records
Mortgage History
| Date | Status | Borrower | Loan Amount |
|---|---|---|---|
| Previous Owner | Kiedrowski Gary M | $240,000 | |
| Closed | Demulling Richard P | $0 |
Source: Public Records
Tax History Compared to Growth
Tax History
| Year | Tax Paid | Tax Assessment Tax Assessment Total Assessment is a certain percentage of the fair market value that is determined by local assessors to be the total taxable value of land and additions on the property. | Land | Improvement |
|---|---|---|---|---|
| 2024 | $3,353 | $200,300 | $11,300 | $189,000 |
| 2023 | $3,677 | $200,300 | $11,300 | $189,000 |
| 2022 | $3,557 | $200,300 | $11,300 | $189,000 |
| 2021 | $3,488 | $200,300 | $11,300 | $189,000 |
| 2020 | $3,343 | $136,400 | $10,000 | $126,400 |
| 2019 | $3,346 | $136,400 | $10,000 | $126,400 |
| 2018 | $3,478 | $136,400 | $10,000 | $126,400 |
| 2017 | $3,102 | $136,400 | $10,000 | $126,400 |
| 2016 | $2,910 | $136,400 | $10,000 | $126,400 |
| 2015 | $2,632 | $140,100 | $15,300 | $124,800 |
| 2013 | $2,319 | $127,500 | $15,300 | $112,200 |
| 2012 | $2,399 | $127,500 | $15,300 | $112,200 |
Source: Public Records
Map
Nearby Homes
- 435 Garfield St
- 459 Roosevelt Dr
- TBD Horsmann Ave
- 115 E Dresser St
- 2383 84th Ave
- 922 248th St
- 2490 91st Ave
- 2462 113th Ave
- XXX 85th Ave
- 2146 84th Ave
- 2486 75th Ave
- 728 Mulligan Dr Unit A
- 890 207th St
- 2055B 85th Ave
- 401 10th Ave
- 502 Kreekview Dr
- 906 Maple Dr
- 1220 Corey Ct
- Lot 61 Simmon Dr
- 301 Ladd Ln
- 427 Garfield St
- 429 Garfield St
- 411 Garfield St
- 461 Roosevelt Dr
- 469 Garfield St
- 467 Garfield St
- 465 Garfield St
- 462 Roosevelt Dr
- 458 Roosevelt Dr
- 456 Roosevelt Dr
- 400 Garfield St
- 412 Garfield St
- 416 Garfield St
- 420 Garfield St
- 424 Garfield St
- 437 Garfield St
- 433 Garfield St
- 421 Garfield St
- 419 Garfield St
- 417 Garfield St