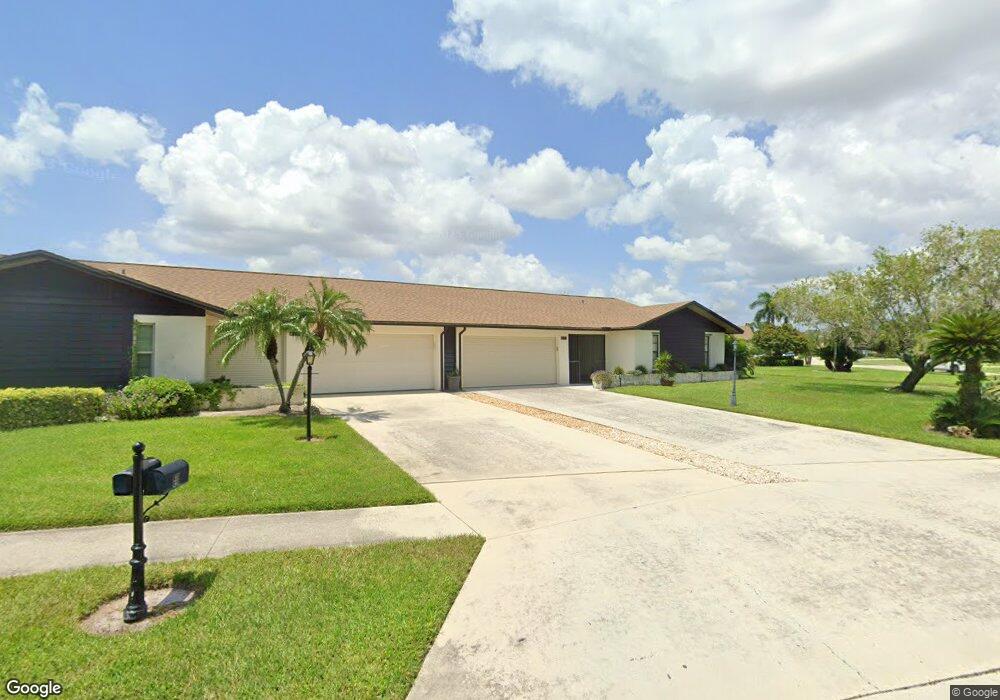
431 Glades Blvd Naples, FL 34112
East Naples NeighborhoodEstimated Value: $346,000 - $439,233
2
Beds
2
Baths
1,913
Sq Ft
$217/Sq Ft
Est. Value
About This Home
This home is located at 431 Glades Blvd, Naples, FL 34112 and is currently estimated at $414,308, approximately $216 per square foot. 431 Glades Blvd is a home located in Collier County with nearby schools including Shadowlawn Elementary School, East Naples Middle School, and Lely High School.
Ownership History
Date
Name
Owned For
Owner Type
Purchase Details
Closed on
Jul 29, 2022
Sold by
Chaparro Duque Ricardo and Chaparro Martha
Bought by
Anzivino Matthew Lawrence and Anzivino Melissa Ann
Current Estimated Value
Home Financials for this Owner
Home Financials are based on the most recent Mortgage that was taken out on this home.
Original Mortgage
$471,306
Outstanding Balance
$448,566
Interest Rate
5.3%
Mortgage Type
FHA
Estimated Equity
-$34,258
Purchase Details
Closed on
Apr 29, 2013
Sold by
Kennedy Marion L
Bought by
Duque Ricardo Chaparro
Home Financials for this Owner
Home Financials are based on the most recent Mortgage that was taken out on this home.
Original Mortgage
$150,255
Interest Rate
3.59%
Mortgage Type
New Conventional
Purchase Details
Closed on
Mar 19, 1998
Sold by
Wands Gordon S and Wands Helen D
Bought by
Kennedy John J
Create a Home Valuation Report for This Property
The Home Valuation Report is an in-depth analysis detailing your home's value as well as a comparison with similar homes in the area
Home Values in the Area
Average Home Value in this Area
Purchase History
| Date | Buyer | Sale Price | Title Company |
|---|---|---|---|
| Anzivino Matthew Lawrence | $480,000 | Sam J Saad Iii | |
| Duque Ricardo Chaparro | $155,000 | First Integrity Title Inc | |
| Kennedy John J | $115,000 | -- |
Source: Public Records
Mortgage History
| Date | Status | Borrower | Loan Amount |
|---|---|---|---|
| Open | Anzivino Matthew Lawrence | $471,306 | |
| Previous Owner | Duque Ricardo Chaparro | $150,255 |
Source: Public Records
Tax History Compared to Growth
Tax History
| Year | Tax Paid | Tax Assessment Tax Assessment Total Assessment is a certain percentage of the fair market value that is determined by local assessors to be the total taxable value of land and additions on the property. | Land | Improvement |
|---|---|---|---|---|
| 2025 | $3,518 | $363,665 | -- | $363,665 |
| 2024 | $3,477 | $360,088 | -- | -- |
| 2023 | $3,477 | $349,600 | $0 | $349,600 |
| 2022 | $1,524 | $156,648 | $0 | $0 |
| 2021 | $1,528 | $152,085 | $0 | $0 |
| 2020 | $1,492 | $149,985 | $0 | $0 |
| 2019 | $1,459 | $146,613 | $0 | $0 |
| 2018 | $1,422 | $143,879 | $0 | $0 |
| 2017 | $1,392 | $140,920 | $0 | $0 |
| 2016 | $1,349 | $138,022 | $0 | $0 |
| 2015 | $1,358 | $137,063 | $0 | $0 |
| 2014 | $1,354 | $85,975 | $0 | $0 |
Source: Public Records
Map
Nearby Homes
- 4802 Lakewood Blvd
- 3832 Snowflake Ln Unit 1207
- 314 Reynolds Ct
- 378 Palm Dr Unit 1
- 355 Palm Dr Unit 732
- 4030 Northlight Dr
- 191 Round Key Cir Unit D-2
- 3750 Northwinds Dr Unit 1010
- 183 Round Key Cir Unit D4
- 4092 Northlight Dr Unit 1707
- 4079 Northlight Dr Unit 1802
- 4001 Ice Castle Way Unit 3607
- 4085 Northlight Dr Unit 5607
- 4021 Ice Castle Way Unit 3407
- 394 Tern Dr Unit 1363 (3)
- 147 Round Key Cir Unit P1
- 3603 Arctic Cir Unit 402
- 4040 Ice Castle Way Unit 2807
- 4040 Ice Castle Way Unit 2802
- 4031 Ice Castle Way Unit 3303
- 431 Glades Blvd Unit B-8
- 427 Glades Blvd
- 4770 Lakewood Blvd Unit B-9
- 4770 Lakewood Blvd
- 423 Glades Blvd
- 4774 Lakewood Blvd
- 419 Glades Blvd Unit B-5
- 419 Glades Blvd
- 4782 Lakewood Blvd
- 415 Glades Blvd Unit A-4
- 415 Glades Blvd
- 426 Glades Blvd Unit N-1
- 426 Glades Blvd
- 422 Glades Blvd
- 4786 Lakewood Blvd
- 4786 Lakewood Blvd Unit 12
- 4775 Lakewood Blvd Unit H2
- 4775 Lakewood Blvd
- 4771 Lakewood Blvd
- 4779 Lakewood Blvd