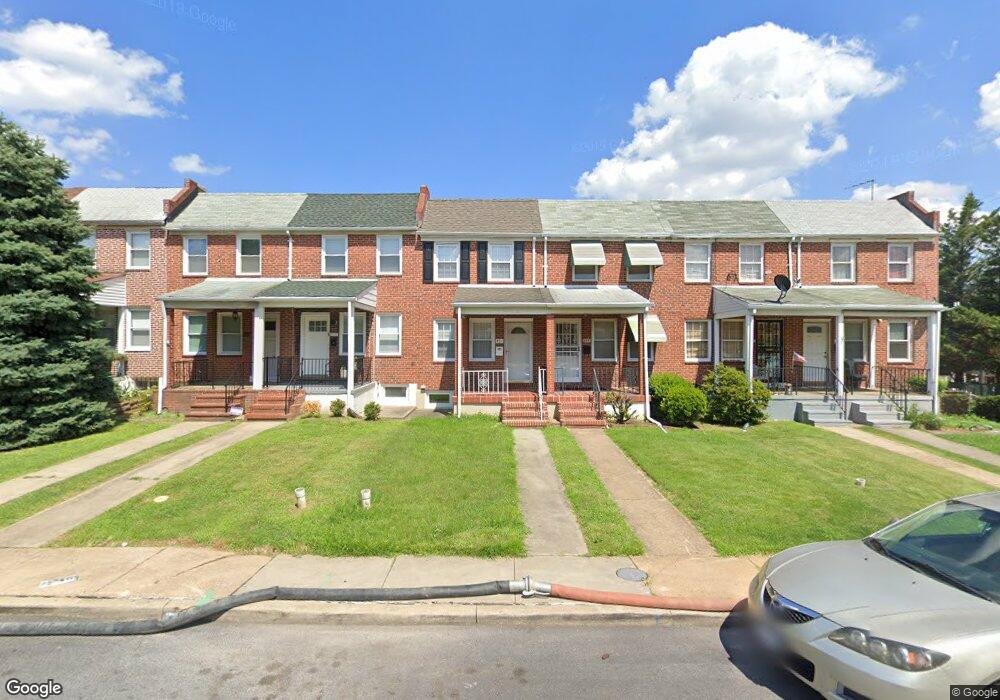
431 Joplin St Baltimore, MD 21224
Estimated Value: $158,476 - $176,000
2
Beds
2
Baths
1,390
Sq Ft
$120/Sq Ft
Est. Value
About This Home
This home is located at 431 Joplin St, Baltimore, MD 21224 and is currently estimated at $167,238, approximately $120 per square foot. 431 Joplin St is a home located in Baltimore City with nearby schools including Graceland Park-O'Donnell Heights Elementary/Middle School, Booker T. Washington Middle School, and Patterson High School.
Ownership History
Date
Name
Owned For
Owner Type
Purchase Details
Closed on
Jul 28, 2008
Sold by
Tax Lien 2000 Llc
Bought by
Deludos Dominic
Current Estimated Value
Purchase Details
Closed on
Jun 30, 2008
Sold by
Tax Lien 2000 Llc
Bought by
Deludos Dominic
Purchase Details
Closed on
Dec 27, 2007
Sold by
Stine Robert A
Bought by
Tax Lien 2000 Llc
Purchase Details
Closed on
Oct 31, 2007
Sold by
Stine Robert A
Bought by
Tax Lien 2000 Llc
Purchase Details
Closed on
Oct 5, 2000
Sold by
Kelly Edward W
Bought by
Stine Robert A
Create a Home Valuation Report for This Property
The Home Valuation Report is an in-depth analysis detailing your home's value as well as a comparison with similar homes in the area
Home Values in the Area
Average Home Value in this Area
Purchase History
| Date | Buyer | Sale Price | Title Company |
|---|---|---|---|
| Deludos Dominic | $82,000 | -- | |
| Deludos Dominic | $82,000 | -- | |
| Tax Lien 2000 Llc | $32,000 | -- | |
| Tax Lien 2000 Llc | $32,000 | -- | |
| Stine Robert A | $24,000 | -- |
Source: Public Records
Tax History Compared to Growth
Tax History
| Year | Tax Paid | Tax Assessment Tax Assessment Total Assessment is a certain percentage of the fair market value that is determined by local assessors to be the total taxable value of land and additions on the property. | Land | Improvement |
|---|---|---|---|---|
| 2025 | $2,513 | $115,700 | $25,000 | $90,700 |
| 2024 | $2,513 | $107,000 | $0 | $0 |
| 2023 | $2,309 | $98,300 | $0 | $0 |
| 2022 | $2,115 | $89,600 | $25,000 | $64,600 |
| 2021 | $2,115 | $89,600 | $25,000 | $64,600 |
| 2020 | $2,115 | $89,600 | $25,000 | $64,600 |
| 2019 | $2,173 | $92,500 | $25,000 | $67,500 |
| 2018 | $2,165 | $91,733 | $0 | $0 |
| 2017 | $2,147 | $90,967 | $0 | $0 |
| 2016 | $1,634 | $90,200 | $0 | $0 |
| 2015 | $1,634 | $83,133 | $0 | $0 |
| 2014 | $1,634 | $76,067 | $0 | $0 |
Source: Public Records
Map
Nearby Homes