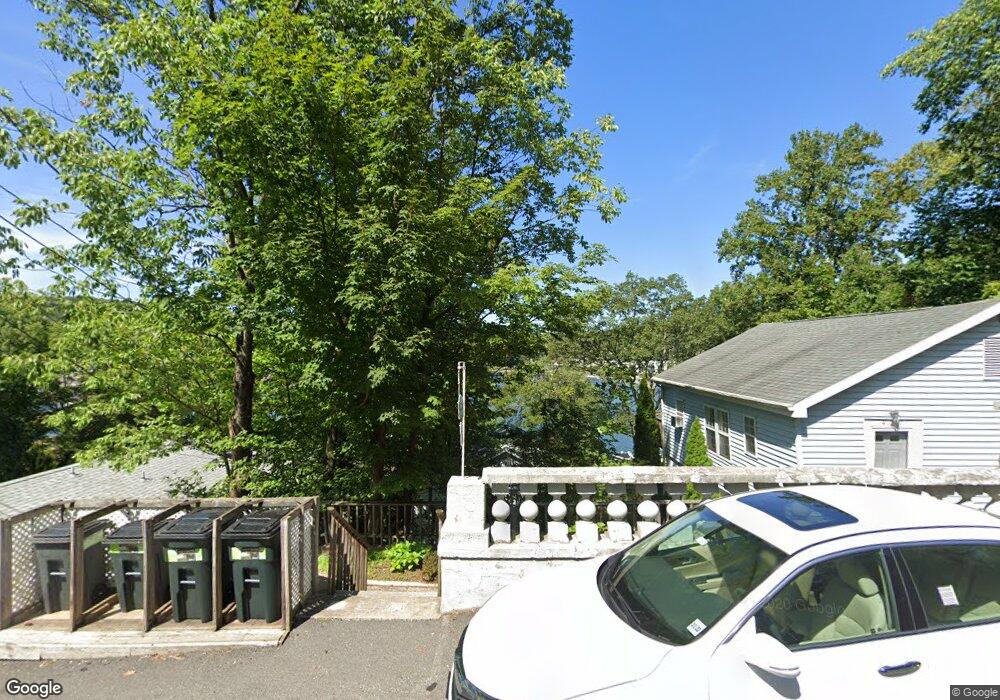
431 Lakeside Blvd Unit 9 Hopatcong, NJ 07843
Estimated Value: $250,000
--
Bed
--
Bath
500
Sq Ft
$500/Sq Ft
Est. Value
About This Home
This home is located at 431 Lakeside Blvd Unit 9, Hopatcong, NJ 07843 and is currently estimated at $250,000, approximately $500 per square foot. 431 Lakeside Blvd Unit 9 is a home located in Sussex County with nearby schools including Hudson Maxim Elementary School, Durban Avenue Elementary School, and Tulsa Trail Elementary School.
Ownership History
Date
Name
Owned For
Owner Type
Purchase Details
Closed on
Jan 31, 2023
Sold by
Botbyl Matthew
Bought by
Intorella Eischen Lori
Current Estimated Value
Purchase Details
Closed on
Feb 19, 2016
Sold by
Intorrella Lori
Bought by
Botbyl Matthew
Purchase Details
Closed on
Oct 2, 2013
Sold by
Lubrano Leonard and Lubrano Judith
Bought by
Intorrella Lori
Purchase Details
Closed on
Mar 8, 2004
Sold by
Duranik Albert and Duranik Robin
Bought by
Lubrano Leonard and Lubrano Judith
Purchase Details
Closed on
Aug 4, 2000
Sold by
Lakeside Living Llc
Bought by
Duranik Albert and Duranik Robin
Home Financials for this Owner
Home Financials are based on the most recent Mortgage that was taken out on this home.
Original Mortgage
$47,400
Interest Rate
8.5%
Mortgage Type
Seller Take Back
Create a Home Valuation Report for This Property
The Home Valuation Report is an in-depth analysis detailing your home's value as well as a comparison with similar homes in the area
Home Values in the Area
Average Home Value in this Area
Purchase History
| Date | Buyer | Sale Price | Title Company |
|---|---|---|---|
| Intorella Eischen Lori | -- | Chicago Title | |
| Botbyl Matthew | -- | Chicago Title Insurance Comp | |
| Intorrella Lori | $115,000 | Multiple | |
| Lubrano Leonard | $125,000 | -- | |
| Duranik Albert | $79,000 | -- |
Source: Public Records
Mortgage History
| Date | Status | Borrower | Loan Amount |
|---|---|---|---|
| Previous Owner | Duranik Albert | $47,400 |
Source: Public Records
Tax History Compared to Growth
Tax History
| Year | Tax Paid | Tax Assessment Tax Assessment Total Assessment is a certain percentage of the fair market value that is determined by local assessors to be the total taxable value of land and additions on the property. | Land | Improvement |
|---|---|---|---|---|
| 2025 | $3,153 | $151,200 | $80,000 | $71,200 |
| 2024 | $4,174 | $151,200 | $80,000 | $71,200 |
| 2023 | $4,174 | $119,300 | $85,000 | $34,300 |
| 2022 | $4,092 | $119,300 | $85,000 | $34,300 |
| 2021 | $4,023 | $119,300 | $85,000 | $34,300 |
| 2020 | $3,981 | $119,300 | $85,000 | $34,300 |
| 2019 | $3,964 | $119,300 | $85,000 | $34,300 |
| 2018 | $3,956 | $119,300 | $85,000 | $34,300 |
| 2017 | $3,950 | $119,300 | $85,000 | $34,300 |
| 2016 | $3,958 | $119,300 | $85,000 | $34,300 |
| 2015 | $3,869 | $119,300 | $85,000 | $34,300 |
| 2014 | $3,856 | $119,300 | $85,000 | $34,300 |
Source: Public Records
Map
Nearby Homes
- 5 W River Styx Rd Unit 302
- 226 Chincopee Ave
- 5 W Unit 204
- 10 N River Styx Rd
- 38 W River Styx Rd
- 8 Walton Rd
- 334 Lakeside Blvd
- 221 Chincopee Ave
- 64 Ithanell Rd
- 331 Lakeside Blvd
- 496 River Styx Rd
- 207 Dupont Ave
- 22 Ithanell Rd
- 8 Oneida Ave
- 167 Marne Rd
- 176 Monroe Trail
- 121 Bucknell Trail
- 59 Hopatchung Rd
- 104 Chincopee Ave
- 151 Monroe Trail
- 431 Lakeside Blvd Unit 3
- 431 Lakeside Blvd Unit 10
- 431 Lakeside Blvd Unit 15
- 431 Lakeside Blvd Unit 4
- 431 Lakeside Blvd Unit 8
- 431 Lakeside Blvd Unit 13
- 431 Lakeside Blvd Unit 14
- 431 Lakeside Blvd Unit 5
- 431 Lakeside Blvd Unit 7
- 431 Lakeside Blvd Unit 6
- 431 Lakeside Blvd Unit 11
- 431 Lakeside Blvd
- 431 Lakeside Blvd
- 429 Lakeside Blvd
- 427 Lakeside Blvd
- 425 Lakeside Blvd
- 433A Lakeside Blvd
- 433 Lakeside Blvd
- 433B Lakeside Blvd
- 435 Lakeside Blvd