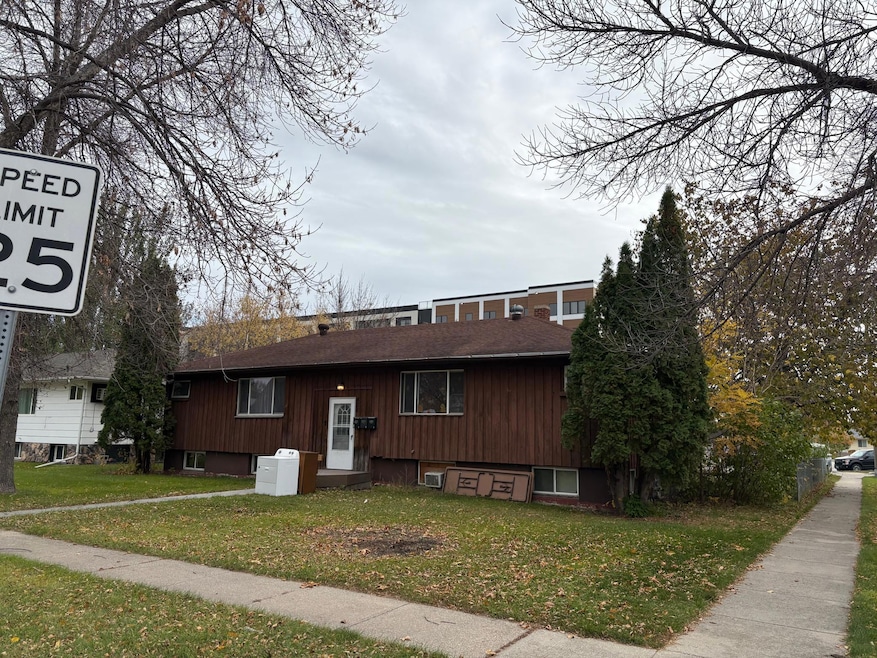
431 Morrison St West Fargo, ND 58078
Francis NeighborhoodEstimated payment $1,570/month
About This Home
Fully rented 3 PLEX in FANTASTIC location next to NEW downtown area of West Fargo!! One 3 bedroom unit, One 2 bedroom Unit, One 1 bedroom unit. Shopping, Restaurants, and much more a few steps away!
Property Details
Home Type
- Multi-Family
Est. Annual Taxes
- $3,100
Year Built
- Built in 1957
Home Design
- Triplex
- Bi-Level Home
- Wood Siding
Bedrooms and Bathrooms
- 7 Bedrooms
- 4 Bathrooms
Utilities
- Baseboard Heating
- Boiler Heating System
Additional Features
- Finished Basement
Community Details
- 3 Units
- Francis 2Nd Subdivision
Listing and Financial Details
- Assessor Parcel Number 02070000670000
Map
Home Values in the Area
Average Home Value in this Area
Tax History
| Year | Tax Paid | Tax Assessment Tax Assessment Total Assessment is a certain percentage of the fair market value that is determined by local assessors to be the total taxable value of land and additions on the property. | Land | Improvement |
|---|---|---|---|---|
| 2024 | $3,931 | $130,750 | $9,200 | $121,550 |
| 2023 | $3,945 | $130,750 | $9,200 | $121,550 |
| 2022 | $3,692 | $116,850 | $9,200 | $107,650 |
| 2021 | $3,373 | $103,800 | $9,200 | $94,600 |
| 2020 | $3,280 | $103,800 | $9,200 | $94,600 |
| 2019 | $3,310 | $104,850 | $9,200 | $95,650 |
| 2018 | $2,214 | $71,550 | $9,200 | $62,350 |
| 2017 | $2,169 | $71,550 | $9,200 | $62,350 |
| 2016 | $1,979 | $71,550 | $9,200 | $62,350 |
| 2015 | $2,054 | $68,500 | $10,500 | $58,000 |
| 2014 | $2,125 | $68,500 | $10,500 | $58,000 |
| 2013 | $2,159 | $68,500 | $10,500 | $58,000 |
Property History
| Date | Event | Price | List to Sale | Price per Sq Ft |
|---|---|---|---|---|
| 11/13/2025 11/13/25 | For Sale | $249,000 | -- | $82 / Sq Ft |
Purchase History
| Date | Type | Sale Price | Title Company |
|---|---|---|---|
| Warranty Deed | $195,000 | Title Co |
Mortgage History
| Date | Status | Loan Amount | Loan Type |
|---|---|---|---|
| Closed | $157,575 | Commercial |
Source: NorthstarMLS
MLS Number: 6817558
APN: 02-0700-00670-000
Disclaimer: Certain information contained herein is derived from information provided by parties other than Homes.com. All information provided is deemed reliable, but is not guaranteed to be accurate and should be independently verified.
![]() Based on information submitted to the MLS GRID. All data is obtained from various sources and may not have been verified by broker or MLS GRID. Supplied Open House Information is subject to change without notice. All information should be independently reviewed and verified for accuracy. Properties may or may not be listed by the office/agent presenting the information. Some IDX listings have been excluded from this website.
Based on information submitted to the MLS GRID. All data is obtained from various sources and may not have been verified by broker or MLS GRID. Supplied Open House Information is subject to change without notice. All information should be independently reviewed and verified for accuracy. Properties may or may not be listed by the office/agent presenting the information. Some IDX listings have been excluded from this website.
The Digital Millennium Copyright Act of 1998, 17 U.S.C. § 512 (the “DMCA”) provides recourse for copyright owners who believe that material appearing on the Internet infringes their rights under U.S. copyright law. If you believe in good faith that any content or material made available in connection with our website or services infringes your copyright, you (or your agent) may send us a notice requesting that the content or material be removed, or access to it blocked.
Notices must be sent in writing by email to DMCAnotice@MLSGrid.com.
The DMCA requires that your notice of alleged copyright infringement include the following information:
(1) description of the copyrighted work that is the subject of claimed infringement;
(2) description of the alleged infringing content and information sufficient to permit us to locate the content;
(3) contact information for you, including your address, telephone number and email address;
(4) a statement by you that you have a good faith belief that the content in the manner complained of is not authorized by the copyright owner, or its agent, or by the operation of any law;
(5) a statement by you, signed under penalty of perjury, that the information in the notification is accurate and that you have the authority to enforce the copyrights that are claimed to be infringed; and
(6) a physical or electronic signature of the copyright owner or a person authorized to act on the copyright owner’s behalf. Failure to include all of the above information may result in the delay of the processing of your complaint.
- 520 6th Ave W Unit 8
- 109 5th Ave W
- 118 2nd Ave W
- 109 7th Ave E
- 320 2nd St E
- 719 5th Ave W
- 901 7th St W
- 226 10 1/2 Ave W
- 209 1st Ave E
- 510 2nd Ave NW
- 961 4th Ave W Unit B
- 326 7th Ave E
- 315 Cedar Ln
- 237 10th Ave E
- 1136 60th Ave W
- 431 5th Ave E Unit 1
- 52 Pinewood Blvd
- 426 3rd Ave E
- 506 5th St E Unit 2
- 541 4th Ave NW
- 444 Sheyenne St
- 300 Sheyenne St
- 113 5th Ave W
- 120 Park Dr Unit 1
- 901 9th St W
- 1207 1st St E
- 626 2nd Ave E Unit 2
- 1400 12th St W
- 1921 Sheyenne St
- 1401 12th St E Unit 6
- 1811 7 St
- 1321 14th Ave E
- 1415 14th Ave E Unit 7
- 1415 14th Ave E
- 1515 14th Ave E Unit 9
- 1305 Queens Way
- 4955 17th Ave S
- 4802 15th Ave S
- 4720 16th Ave SW
- 401 26th Ave W
