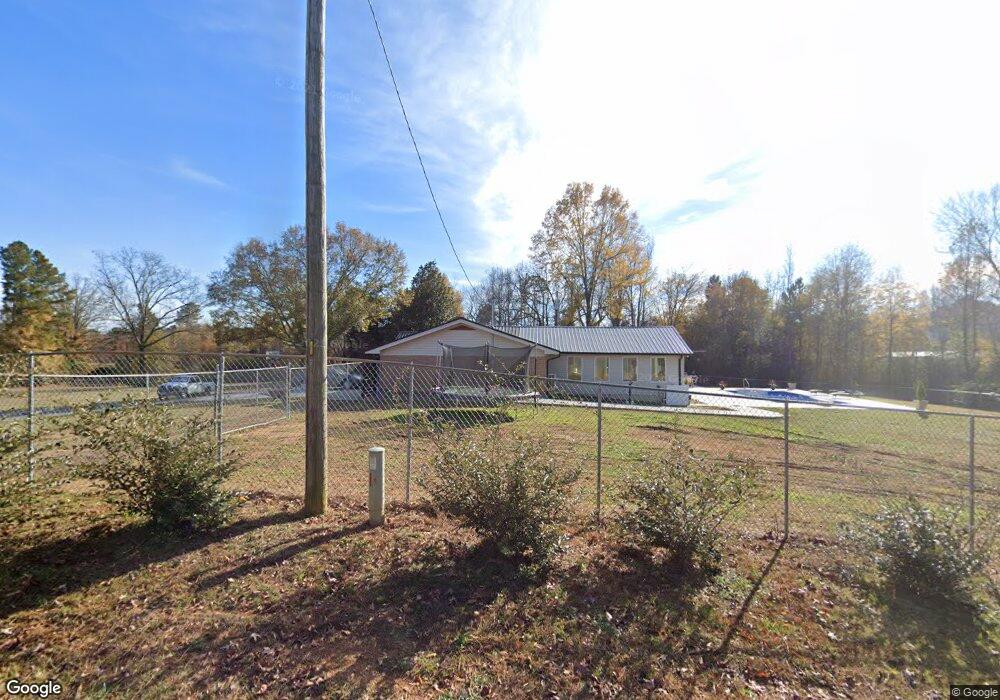
431 Richardson Rd NE Dalton, GA 30721
Estimated Value: $286,438 - $363,000
3
Beds
2
Baths
1,248
Sq Ft
$248/Sq Ft
Est. Value
About This Home
This home is located at 431 Richardson Rd NE, Dalton, GA 30721 and is currently estimated at $309,860, approximately $248 per square foot. 431 Richardson Rd NE is a home located in Whitfield County with nearby schools including Dawnville Elementary School and Coahulla Creek High School.
Ownership History
Date
Name
Owned For
Owner Type
Purchase Details
Closed on
Jul 24, 2017
Sold by
Cash Tracy
Bought by
Aragon Castillo Alexander
Current Estimated Value
Home Financials for this Owner
Home Financials are based on the most recent Mortgage that was taken out on this home.
Original Mortgage
$98,188
Outstanding Balance
$82,632
Interest Rate
4.37%
Mortgage Type
FHA
Estimated Equity
$227,228
Purchase Details
Closed on
Apr 1, 2013
Sold by
Walston Tony
Bought by
Cash Tracy W and Cash Saundra
Purchase Details
Closed on
Feb 2, 2007
Sold by
Not Provided
Bought by
Petit Alexandra
Purchase Details
Closed on
Jan 20, 2007
Sold by
Not Provided
Bought by
Petit Alexandra
Purchase Details
Closed on
Jul 7, 2006
Sold by
Not Provided
Bought by
Petit Alexandra
Purchase Details
Closed on
Jun 1, 1996
Bought by
Cash Tracy and Cash Sandy
Create a Home Valuation Report for This Property
The Home Valuation Report is an in-depth analysis detailing your home's value as well as a comparison with similar homes in the area
Home Values in the Area
Average Home Value in this Area
Purchase History
| Date | Buyer | Sale Price | Title Company |
|---|---|---|---|
| Aragon Castillo Alexander | $100,000 | -- | |
| Cash Tracy W | $30,000 | -- | |
| Petit Alexandra | $78,000 | -- | |
| Petit Alexandra | -- | -- | |
| Petit Alexandra | $63,991 | -- | |
| Cash Tracy | $91,000 | -- |
Source: Public Records
Mortgage History
| Date | Status | Borrower | Loan Amount |
|---|---|---|---|
| Open | Aragon Castillo Alexander | $98,188 |
Source: Public Records
Tax History Compared to Growth
Tax History
| Year | Tax Paid | Tax Assessment Tax Assessment Total Assessment is a certain percentage of the fair market value that is determined by local assessors to be the total taxable value of land and additions on the property. | Land | Improvement |
|---|---|---|---|---|
| 2024 | $1,740 | $99,990 | $9,970 | $90,020 |
| 2023 | $1,740 | $57,091 | $7,459 | $49,632 |
| 2022 | $1,046 | $44,014 | $6,550 | $37,464 |
| 2021 | $1,046 | $44,014 | $6,550 | $37,464 |
| 2020 | $1,070 | $44,014 | $6,550 | $37,464 |
| 2019 | $1,082 | $44,014 | $6,550 | $37,464 |
| 2018 | $968 | $47,691 | $5,278 | $42,413 |
| 2017 | $1,211 | $47,691 | $5,278 | $42,413 |
| 2016 | $1,061 | $43,853 | $5,278 | $38,575 |
| 2014 | $1,004 | $44,686 | $6,111 | $38,575 |
| 2013 | -- | $44,686 | $6,111 | $38,574 |
Source: Public Records
Map
Nearby Homes
- 4363 Bass Dr NE
- 4685 Mitchell Bridge Rd NE
- 620 Lower Dawnville Rd NE
- 0 Rollins Ketchum Rd
- 1259 Rollins Ketchum Rd
- 3871 Miller Dr NE
- 4960 Mark Brown Rd NE
- 1070 Dawnville Rd NE
- 162 Alcoa Dr
- 230 Indian Dr NE
- Lot 63 Cherokee Dr NE
- 1507 Lynnwood Dr NE
- Lot 30-33 Indian Trail NE
- Lt 30-33 Indian Dr NE
- 3922 Miller Dr NE
- 111 Arthur St
- 0 Cheree Way Unit 129259
- 421 Coahulla Creek Dr
- 5111 Mark Brown Rd NE
- 0 Monterey Drve Unit 127837
- 451 Richardson Rd NE
- 415 Richardson Rd NE
- 418 Richardson Rd NE
- 263 Yellowwood Way
- 271 Yellowwood Way
- 400 Richardson Rd NE Unit A
- 380 Richardson Rd NE
- 363 Richardson Rd NE
- 363 Richardson Rd NE
- 4379 Polly Rd NE
- 4331 Polly Rd NE
- 252 Kingfisher Way
- 496 Richardson Rd NE
- 360 Richardson Rd NE
- 498 Richardson Rd NE
- 4375 Polly Rd NE
- 535 Richardson Rd NE
- 4337 Polly Rd NE
- 488 Lower Dawnville Rd NE
- 4335 Polly Rd NE