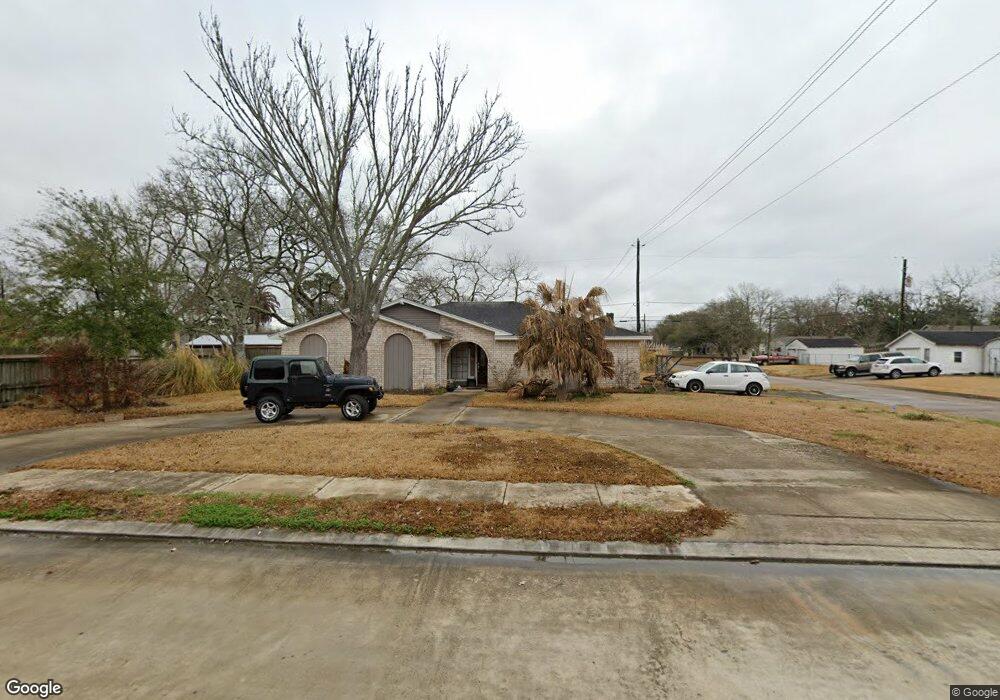
431 S 3rd St La Porte, TX 77571
Estimated Value: $312,000 - $391,000
4
Beds
2
Baths
3,218
Sq Ft
$107/Sq Ft
Est. Value
About This Home
This home is located at 431 S 3rd St, La Porte, TX 77571 and is currently estimated at $345,071, approximately $107 per square foot. 431 S 3rd St is a home located in Harris County with nearby schools including La Porte Elementary School, La Porte Junior High School, and La Porte High School.
Ownership History
Date
Name
Owned For
Owner Type
Purchase Details
Closed on
Mar 10, 1999
Sold by
Ford Donald F and Ford Donald F
Bought by
Westergren Fred E
Current Estimated Value
Purchase Details
Closed on
Jul 17, 1997
Sold by
Moore & Moore General Contractors Inc
Bought by
Westergren Linda and Westergren Fred
Home Financials for this Owner
Home Financials are based on the most recent Mortgage that was taken out on this home.
Original Mortgage
$45,000
Interest Rate
7.85%
Purchase Details
Closed on
Nov 15, 1996
Sold by
Medlin T C
Bought by
Westergren Fred E
Purchase Details
Closed on
Jul 3, 1996
Sold by
Clear Lake National Bank
Bought by
Westergren Linda
Home Financials for this Owner
Home Financials are based on the most recent Mortgage that was taken out on this home.
Original Mortgage
$70,000
Interest Rate
8.33%
Mortgage Type
Seller Take Back
Purchase Details
Closed on
Jun 4, 1996
Sold by
Westergren Fred E and Westergren Linda G
Bought by
Leppo Craig O and Leppo Jo Anne I
Home Financials for this Owner
Home Financials are based on the most recent Mortgage that was taken out on this home.
Original Mortgage
$70,000
Interest Rate
8.33%
Mortgage Type
Seller Take Back
Create a Home Valuation Report for This Property
The Home Valuation Report is an in-depth analysis detailing your home's value as well as a comparison with similar homes in the area
Home Values in the Area
Average Home Value in this Area
Purchase History
| Date | Buyer | Sale Price | Title Company |
|---|---|---|---|
| Westergren Fred E | -- | American Title Co | |
| Westergren Linda | -- | Alamo Title | |
| Westergren Fred E | -- | -- | |
| Westergren Linda | -- | American Title Company | |
| Leppo Craig O | -- | -- |
Source: Public Records
Mortgage History
| Date | Status | Borrower | Loan Amount |
|---|---|---|---|
| Previous Owner | Westergren Linda | $45,000 | |
| Previous Owner | Westergren Linda | $70,000 | |
| Previous Owner | Leppo Craig O | $87,400 |
Source: Public Records
Tax History Compared to Growth
Tax History
| Year | Tax Paid | Tax Assessment Tax Assessment Total Assessment is a certain percentage of the fair market value that is determined by local assessors to be the total taxable value of land and additions on the property. | Land | Improvement |
|---|---|---|---|---|
| 2025 | $423 | $307,157 | $63,750 | $243,407 |
| 2024 | $423 | $278,747 | $63,750 | $214,997 |
| 2023 | $423 | $383,000 | $63,750 | $319,250 |
| 2022 | $6,150 | $278,885 | $63,750 | $215,135 |
| 2021 | $5,724 | $210,372 | $60,000 | $150,372 |
| 2020 | $5,382 | $208,175 | $37,500 | $170,675 |
| 2019 | $5,103 | $216,000 | $37,500 | $178,500 |
| 2018 | $390 | $194,365 | $22,500 | $171,865 |
| 2017 | $4,280 | $188,494 | $18,750 | $169,744 |
| 2016 | $3,891 | $155,948 | $18,750 | $137,198 |
| 2015 | $535 | $120,000 | $18,750 | $101,250 |
| 2014 | $535 | $162,400 | $18,750 | $143,650 |
Source: Public Records
Map
Nearby Homes
- 416 S 1st St
- 507 S 3rd St
- 424 S Broadway St
- 531 S 2nd St
- 1200 BLOCK S 2nd St
- 216 San Jacinto St
- 317 San Jacinto St
- 407 San Jacinto St
- 705 S 2nd St Unit 705
- 0 Broadway Unit 47596766
- 301 S Virginia St
- 0 N 1st Ave
- 1100 BLOCK S 6th St
- 208 S 7th St
- 123 S Virginia St
- 135 S Virginia St
- 131 S Virginia St
- 729 S 5th St
- 0 S 7th Unit 2930812
- 114 Dr Martin Luther King jr Dr