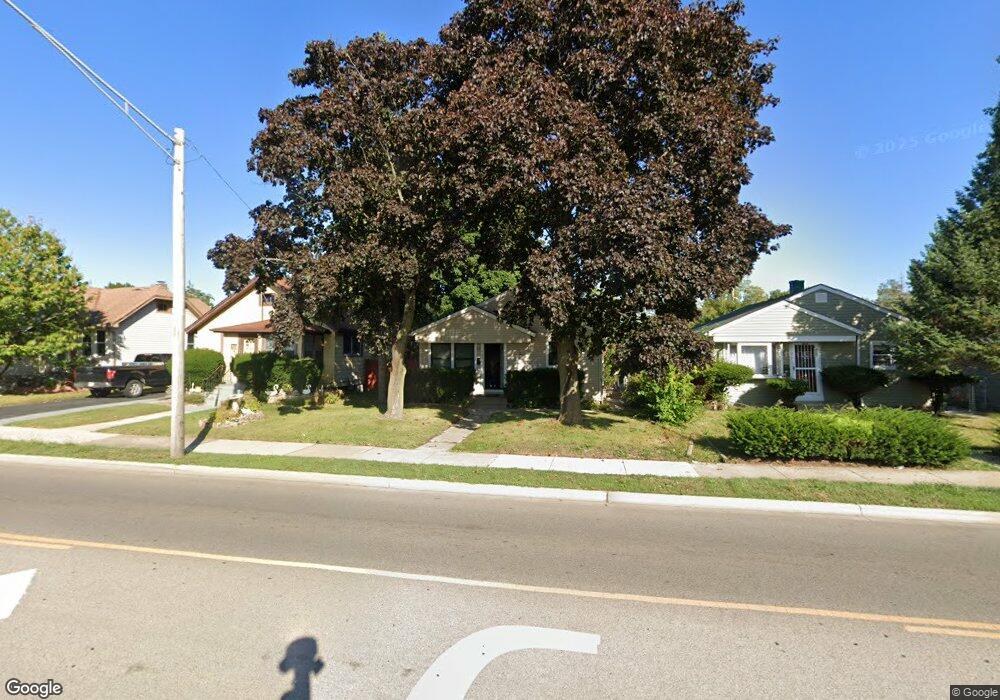
431 S Lewis Ave Waukegan, IL 60085
West Waukegan NeighborhoodEstimated Value: $157,000 - $173,000
2
Beds
1
Bath
780
Sq Ft
$210/Sq Ft
Est. Value
About This Home
This home is located at 431 S Lewis Ave, Waukegan, IL 60085 and is currently estimated at $163,759, approximately $209 per square foot. 431 S Lewis Ave is a home located in Lake County with nearby schools including Washington Elementary School, Robert E. Abbott Middle School, and Waukegan High School.
Ownership History
Date
Name
Owned For
Owner Type
Purchase Details
Closed on
May 17, 2010
Sold by
Secretary Of Housing & Urban Development
Bought by
Jimenez Victor H
Current Estimated Value
Purchase Details
Closed on
Oct 19, 2009
Sold by
Villanueva
Bought by
The Secretary Of Housing & Urban Develop
Purchase Details
Closed on
Nov 22, 1999
Sold by
Hud
Bought by
Villanueva Carlos
Home Financials for this Owner
Home Financials are based on the most recent Mortgage that was taken out on this home.
Original Mortgage
$54,550
Interest Rate
7.97%
Mortgage Type
FHA
Purchase Details
Closed on
Aug 29, 1996
Sold by
Ocampo Jose and Ocampo Dario O
Bought by
Juarez Julian G and Espinoza Trinidad Reyna
Home Financials for this Owner
Home Financials are based on the most recent Mortgage that was taken out on this home.
Original Mortgage
$68,916
Interest Rate
8.27%
Mortgage Type
FHA
Create a Home Valuation Report for This Property
The Home Valuation Report is an in-depth analysis detailing your home's value as well as a comparison with similar homes in the area
Home Values in the Area
Average Home Value in this Area
Purchase History
| Date | Buyer | Sale Price | Title Company |
|---|---|---|---|
| Jimenez Victor H | -- | Stewart Title Company | |
| The Secretary Of Housing & Urban Develop | -- | None Available | |
| Villanueva Carlos | -- | Stewart Title Company | |
| Juarez Julian G | $69,000 | Ticor Title Insurance Compan |
Source: Public Records
Mortgage History
| Date | Status | Borrower | Loan Amount |
|---|---|---|---|
| Previous Owner | Villanueva Carlos | $54,550 | |
| Previous Owner | Juarez Julian G | $68,916 |
Source: Public Records
Tax History Compared to Growth
Tax History
| Year | Tax Paid | Tax Assessment Tax Assessment Total Assessment is a certain percentage of the fair market value that is determined by local assessors to be the total taxable value of land and additions on the property. | Land | Improvement |
|---|---|---|---|---|
| 2024 | $2,955 | $35,031 | $6,600 | $28,431 |
| 2023 | $2,738 | $31,336 | $5,904 | $25,432 |
| 2022 | $2,738 | $28,005 | $4,979 | $23,026 |
| 2021 | $2,445 | $23,447 | $4,283 | $19,164 |
| 2020 | $2,476 | $21,844 | $3,990 | $17,854 |
| 2019 | $2,492 | $20,016 | $3,656 | $16,360 |
| 2018 | $2,329 | $18,011 | $5,176 | $12,835 |
| 2017 | $2,267 | $15,934 | $4,579 | $11,355 |
| 2016 | $2,140 | $13,846 | $3,979 | $9,867 |
| 2015 | $2,093 | $12,392 | $3,561 | $8,831 |
| 2014 | $3,223 | $19,051 | $3,577 | $15,474 |
| 2012 | $2,343 | $20,640 | $3,876 | $16,764 |
Source: Public Records
Map
Nearby Homes
- 49 S Lewis Ave
- 12601 W Atlantic Ave
- 2116 & 2101 Williamsburg Dr
- 1521 Catalpa Ave
- 446 S Jackson St
- 1416 Hamilton Ct
- 819 S Fulton Ave
- 2726 W Hidden Glen Dr
- 304 Powell Ave
- 23 N Jackson St
- 910 Cummings Ave
- 408 Besley Place
- 305 Besley Place
- 613 Clarke Ave
- 24 Washington Terrace
- 610 Bluff St
- 600 Sunderlin St
- 215 S Park Ave
- 613 Washington St
- 28 N Saint James St
- 427 S Lewis Ave
- 433 S Lewis Ave
- 437 S Lewis Ave
- 425 S Lewis Ave
- 441 S Lewis Ave
- 423 S Lewis Ave
- 432 S Elmwood Ave
- 428 S Elmwood Ave
- 434 S Elmwood Ave
- 443 S Lewis Ave
- 424 S Elmwood Ave
- 421 S Lewis Ave
- 438 S Elmwood Ave
- 420 S Elmwood Ave
- 440 S Elmwood Ave
- 1818 Dodge Ave
- 444 S Elmwood Ave
- 418 S Elmwood Ave
- 417 S Lewis Ave
- 416 S Elmwood Ave