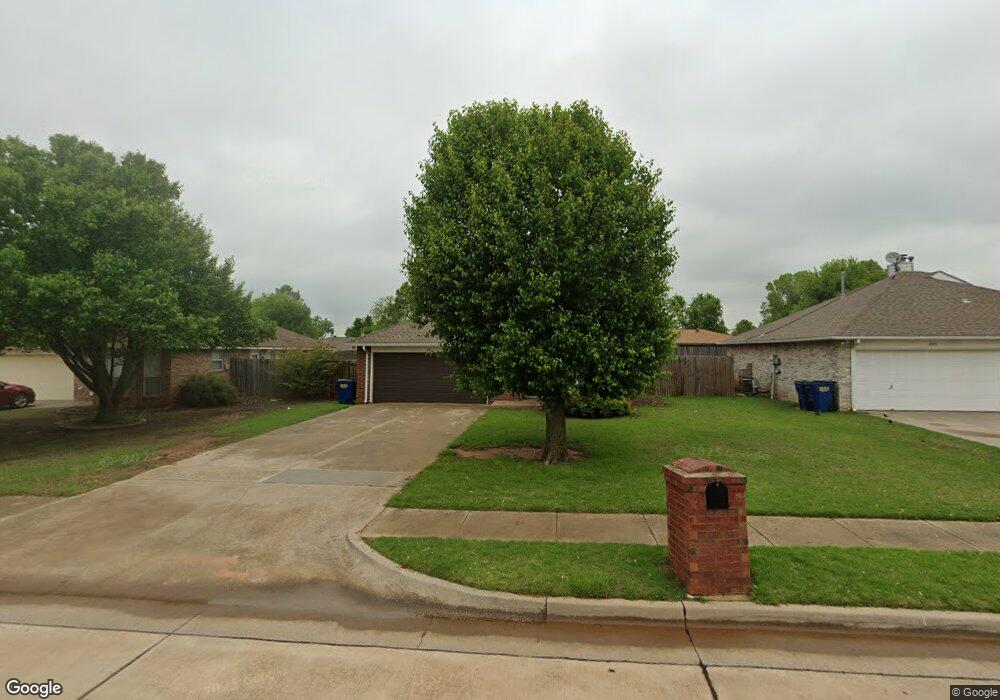
431 W Chantilly Way Mustang, OK 73064
Estimated Value: $186,000 - $216,000
3
Beds
2
Baths
1,250
Sq Ft
$160/Sq Ft
Est. Value
About This Home
This home is located at 431 W Chantilly Way, Mustang, OK 73064 and is currently estimated at $199,562, approximately $159 per square foot. 431 W Chantilly Way is a home located in Canadian County with nearby schools including Mustang Centennial Elementary School, Mustang Horizon Intermediate School, and Mustang Middle School.
Ownership History
Date
Name
Owned For
Owner Type
Purchase Details
Closed on
Jun 9, 2005
Sold by
Creach Brett Michael and Creach Sarah M
Bought by
Hemphill Amy L
Current Estimated Value
Home Financials for this Owner
Home Financials are based on the most recent Mortgage that was taken out on this home.
Original Mortgage
$88,200
Outstanding Balance
$50,368
Interest Rate
7.25%
Mortgage Type
Adjustable Rate Mortgage/ARM
Estimated Equity
$149,194
Purchase Details
Closed on
May 9, 2001
Sold by
Creach Brett Michael
Purchase Details
Closed on
Aug 1, 2000
Sold by
Danielson Darren and Danielson Kimbre
Purchase Details
Closed on
Jan 4, 1999
Sold by
Danielson Darren W
Purchase Details
Closed on
Aug 27, 1998
Sold by
Choice Homes Texas Inc
Purchase Details
Closed on
May 5, 1998
Sold by
Branches Six Limited Ptnrship
Create a Home Valuation Report for This Property
The Home Valuation Report is an in-depth analysis detailing your home's value as well as a comparison with similar homes in the area
Home Values in the Area
Average Home Value in this Area
Purchase History
| Date | Buyer | Sale Price | Title Company |
|---|---|---|---|
| Hemphill Amy L | $73,500 | Stewart Abstract & Title Of | |
| -- | -- | -- | |
| -- | $79,500 | -- | |
| -- | -- | -- | |
| -- | $71,000 | -- | |
| -- | $26,000 | -- |
Source: Public Records
Mortgage History
| Date | Status | Borrower | Loan Amount |
|---|---|---|---|
| Open | Hemphill Amy L | $88,200 |
Source: Public Records
Tax History Compared to Growth
Tax History
| Year | Tax Paid | Tax Assessment Tax Assessment Total Assessment is a certain percentage of the fair market value that is determined by local assessors to be the total taxable value of land and additions on the property. | Land | Improvement |
|---|---|---|---|---|
| 2024 | $1,326 | $14,720 | $1,800 | $12,920 |
| 2023 | $1,326 | $14,291 | $1,800 | $12,491 |
| 2022 | $1,300 | $13,875 | $1,800 | $12,075 |
| 2021 | $1,320 | $14,022 | $1,800 | $12,222 |
| 2020 | $1,358 | $14,317 | $1,800 | $12,517 |
| 2019 | $1,328 | $14,016 | $1,800 | $12,216 |
| 2018 | $1,314 | $13,607 | $1,800 | $11,807 |
| 2017 | $1,299 | $13,604 | $1,800 | $11,804 |
| 2016 | $1,260 | $13,376 | $1,800 | $11,576 |
| 2015 | $1,362 | $12,823 | $1,800 | $11,023 |
| 2014 | $1,362 | $13,116 | $1,560 | $11,556 |
Source: Public Records
Map
Nearby Homes
- 534 W Pine Rose Court Way
- 413 W Pines Way
- 557 W Pine Rose Court Way
- 531 W Shadow Ridge Way
- 338 W Crooked Branch Way
- 601 N Chisholm Trail Way
- 304 N Geronimo Way
- 3629 Blue Ave
- 3641 Pete St
- 3637 Blue Ave
- 500 N Remington Way
- 350 W Elder Dr
- 608 N Remington Way
- 433 W Forest Dr
- 0 N Mustang Rd
- 0 N Mustang Rd
- 14900 SW 74th St
- 14842 SW 74th St
- 912 N Barn Hill Way
- 0 N Czech Hall Rd
- 435 W Chantilly Way
- 425 W Chantilly Way
- 439 W Chantilly Way
- 434 W Maple Branch Way
- 421 W Chantilly Way
- 428 W Maple Branch Way
- 440 W Maple Branch Way
- 422 W Maple Branch Way
- 417 W Chantilly Way
- 430 W Chantilly Way
- 446 W Maple Branch Way
- 426 W Chantilly Way
- 434 W Chantilly Way
- 443 W Chantilly Way
- 422 W Chantilly Way
- 438 W Chantilly Way
- 416 W Maple Branch Way
- 413 W Chantilly Way
- 452 W Maple Branch Way
- 418 W Chantilly Way