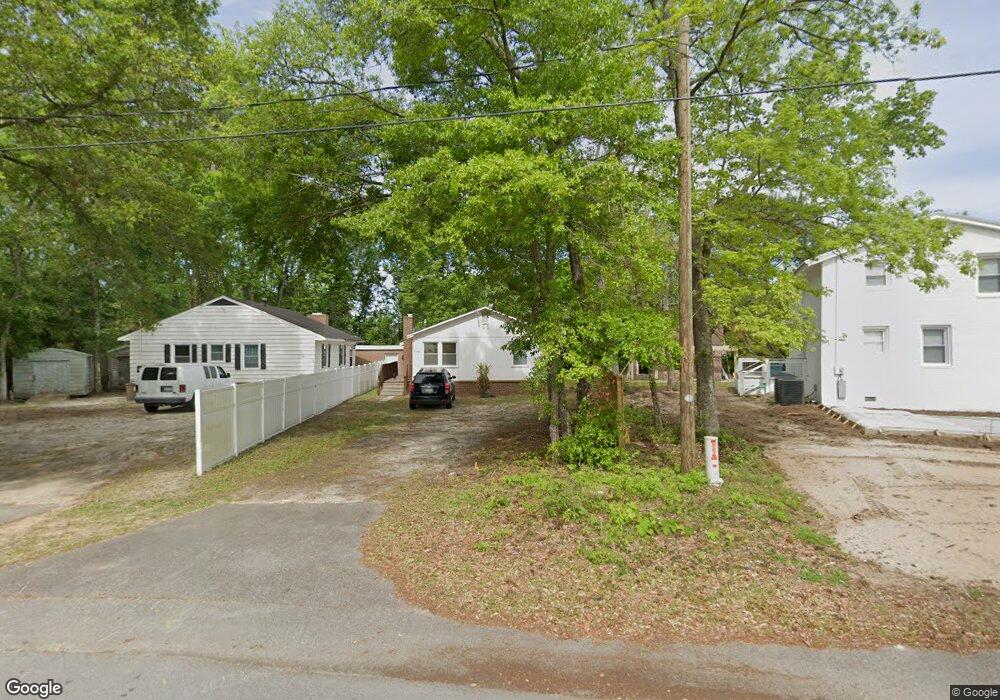
431 Wando St Murrells Inlet, SC 29576
Estimated Value: $442,000 - $728,661
3
Beds
2
Baths
2,136
Sq Ft
$282/Sq Ft
Est. Value
About This Home
This home is located at 431 Wando St, Murrells Inlet, SC 29576 and is currently estimated at $602,415, approximately $282 per square foot. 431 Wando St is a home located in Horry County with nearby schools including Seaside Elementary, St. James Middle School, and St. James Intermediate.
Ownership History
Date
Name
Owned For
Owner Type
Purchase Details
Closed on
Dec 8, 2021
Sold by
Rooks Connie W
Bought by
Harris Ellen D
Current Estimated Value
Home Financials for this Owner
Home Financials are based on the most recent Mortgage that was taken out on this home.
Original Mortgage
$4,909
Outstanding Balance
$1,212
Interest Rate
2.98%
Mortgage Type
New Conventional
Estimated Equity
$601,203
Purchase Details
Closed on
Jul 2, 2013
Sold by
Carter Debra C
Bought by
Rooks Ronald F
Purchase Details
Closed on
Feb 5, 2010
Sold by
Carter Thomas Michael
Bought by
Carter Debra C
Purchase Details
Closed on
Jan 1, 2004
Sold by
Carter Ernest V
Bought by
Carter Thomas Michael and Carter Debra C
Home Financials for this Owner
Home Financials are based on the most recent Mortgage that was taken out on this home.
Original Mortgage
$80,000
Interest Rate
6.03%
Mortgage Type
Purchase Money Mortgage
Create a Home Valuation Report for This Property
The Home Valuation Report is an in-depth analysis detailing your home's value as well as a comparison with similar homes in the area
Home Values in the Area
Average Home Value in this Area
Purchase History
| Date | Buyer | Sale Price | Title Company |
|---|---|---|---|
| Harris Ellen D | $100,000 | -- | |
| Rooks Ronald F | $175,000 | -- | |
| Carter Debra C | -- | -- | |
| Carter Thomas Michael | $80,000 | -- |
Source: Public Records
Mortgage History
| Date | Status | Borrower | Loan Amount |
|---|---|---|---|
| Open | Harris Ellen D | $4,909 | |
| Previous Owner | Carter Thomas Michael | $80,000 |
Source: Public Records
Tax History Compared to Growth
Tax History
| Year | Tax Paid | Tax Assessment Tax Assessment Total Assessment is a certain percentage of the fair market value that is determined by local assessors to be the total taxable value of land and additions on the property. | Land | Improvement |
|---|---|---|---|---|
| 2024 | -- | $28,196 | $17,729 | $10,467 |
| 2023 | $3,054 | $12,074 | $5,636 | $6,438 |
| 2021 | $4,757 | $17,478 | $7,308 | $10,170 |
| 2020 | $2,440 | $17,478 | $7,308 | $10,170 |
| 2019 | $2,440 | $17,478 | $7,308 | $10,170 |
| 2018 | $2,202 | $10,499 | $4,901 | $5,598 |
| 2017 | $2,187 | $10,499 | $4,901 | $5,598 |
| 2016 | -- | $10,499 | $4,901 | $5,598 |
| 2015 | $2,187 | $10,499 | $4,901 | $5,598 |
| 2014 | $2,375 | $12,071 | $4,901 | $7,170 |
Source: Public Records
Map
Nearby Homes
- 513 1st St
- 390 Boundary Ave
- 520 & 526 Boundary Ave
- 1508 Sunnydale Ln
- 724 1st St
- 316 Cypress Ave
- Lot 4 Seacrest Dr
- 449 Delton Dr
- 425 Delton Dr
- 527 Bay Drive Extension
- 399 Elizabeth Dr
- 435 Delton Dr
- 806 Marlin Ct
- 818 Keel Ct
- 709 Triple Oak Ln
- 310 Clam Shell Cir
- 495 Clubhouse Rd
- 809 Marlin Ct
- 315 Inlet Rd
- 326 Tunnoch Rd
- 431 Wando St Unit A&B
- 430 Belle Dr
- 405 Pine Ave
- Lot 1-B Wando Rd
- 448 Belle Dr
- 411 Wando St
- 335 Windover Ct
- 424 Belle Dr
- 416 Belle Dr
- 333 Pine Ave
- Lot 11 Yaupon Ave
- Lot 4 Yaupon Ave
- 501 1st St
- 501 1st St Unit Lot 7 First St
- 501 1st St Unit Lot 7 Cattail Cove
- Lot 3 Wando St
- 433 Belle Dr
- 425 Belle Dr
- 449 Belle Dr
- 329 Pine Ave