Estimated Value: $98,000 - $161,000
--
Bed
--
Bath
1,372
Sq Ft
$106/Sq Ft
Est. Value
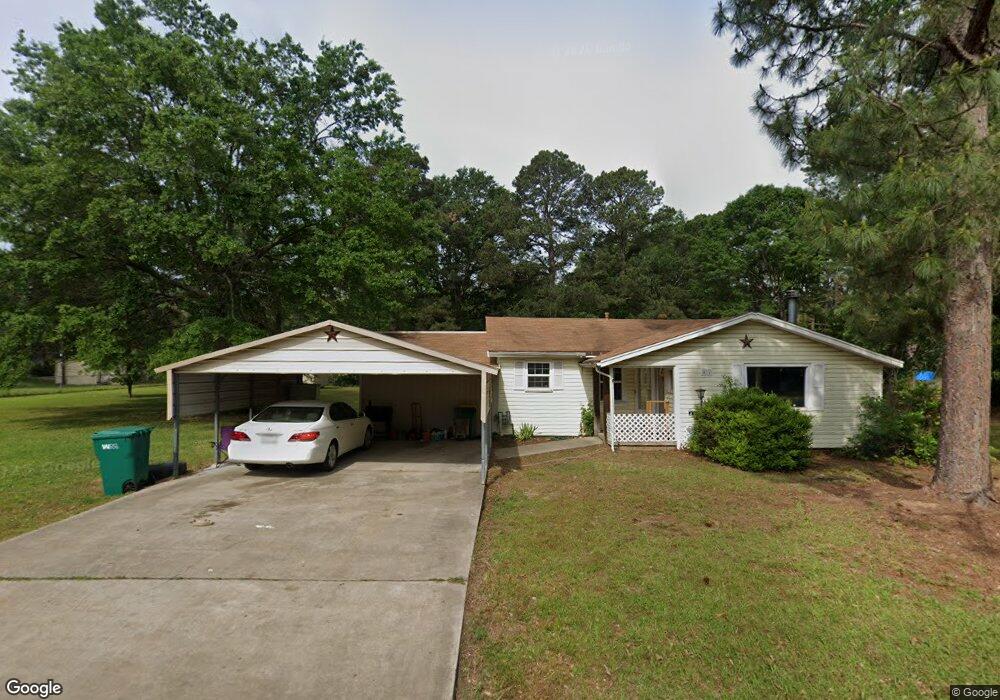
About This Home
This home is located at 431 Watts St, Nash, TX 75569 and is currently estimated at $144,997, approximately $105 per square foot. 431 Watts St is a home located in Bowie County with nearby schools including Nash Elementary School, Texas Middle School, and Texas High School.
Ownership History
Date
Name
Owned For
Owner Type
Purchase Details
Closed on
Jul 31, 2024
Sold by
Mcmurtre Billy
Bought by
Nixon Chantel
Current Estimated Value
Purchase Details
Closed on
Apr 5, 2021
Sold by
Phillips Gerald G and Phillips Audrey L
Bought by
Mcnixon Properties Llc
Purchase Details
Closed on
Jan 29, 2010
Sold by
Gregory Johnny E and Gregory Karen Elaine
Bought by
Phillips Gerald G and Phillips Audrey L
Home Financials for this Owner
Home Financials are based on the most recent Mortgage that was taken out on this home.
Original Mortgage
$69,698
Interest Rate
5.37%
Mortgage Type
FHA
Create a Home Valuation Report for This Property
The Home Valuation Report is an in-depth analysis detailing your home's value as well as a comparison with similar homes in the area
Home Values in the Area
Average Home Value in this Area
Purchase History
| Date | Buyer | Sale Price | Title Company |
|---|---|---|---|
| Nixon Chantel | -- | Twin City Title | |
| Mcnixon Properties Llc | -- | None Available | |
| Phillips Gerald G | -- | None Available |
Source: Public Records
Mortgage History
| Date | Status | Borrower | Loan Amount |
|---|---|---|---|
| Previous Owner | Phillips Gerald G | $69,698 |
Source: Public Records
Tax History Compared to Growth
Tax History
| Year | Tax Paid | Tax Assessment Tax Assessment Total Assessment is a certain percentage of the fair market value that is determined by local assessors to be the total taxable value of land and additions on the property. | Land | Improvement |
|---|---|---|---|---|
| 2025 | $1,048 | $95,170 | $15,500 | $79,670 |
| 2024 | $1,048 | $53,896 | $12,500 | $41,396 |
| 2023 | $1,718 | $86,487 | $12,500 | $73,987 |
| 2022 | $1,620 | $78,742 | $12,500 | $66,242 |
| 2021 | $1,550 | $66,963 | $12,500 | $54,463 |
| 2020 | $1,450 | $64,453 | $12,500 | $51,953 |
| 2019 | $1,568 | $62,057 | $12,500 | $49,557 |
| 2018 | $1,565 | $60,994 | $12,500 | $48,494 |
| 2017 | $1,515 | $60,079 | $12,500 | $47,579 |
| 2016 | $1,515 | $60,079 | $12,500 | $47,579 |
| 2015 | $771 | $60,478 | $12,500 | $47,978 |
| 2014 | $771 | $58,698 | $12,500 | $46,198 |
Source: Public Records
Map
Nearby Homes
- 436 Johnson St
- 441 Johnson St
- 608 Johnson St
- 281 Post St
- 220 Johnson St
- 474 Greenwood Ave
- 165 Greenforest Trail
- TBD N Kings Hwy
- 136 W New Boston Rd
- 246 Birch St
- 2907 Pleasant Grove Rd
- 150 Waymeadow Dr
- 21 Dustin Terrace
- 18 Kay Cir
- 180 Ochsenbein Rd
- 112 Kay St
- 33 Green Oak Cir
- 16 Pecan Valley Cir
- 34 Dustin Terrace
- 58 Green Oak Cir