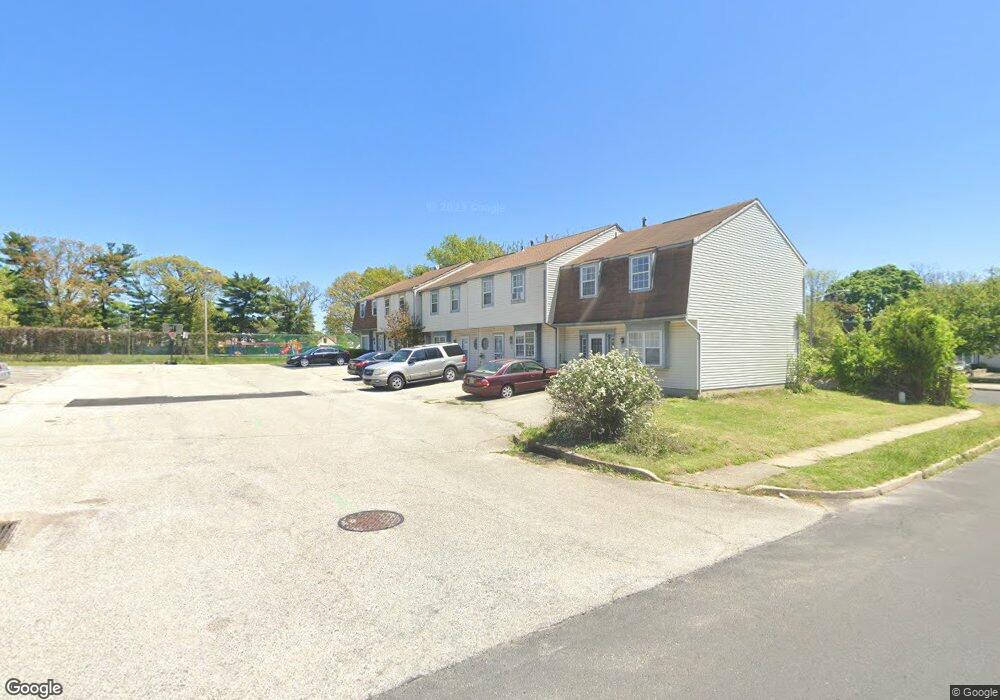
4310 Amon Ct Pennsauken, NJ 08110
Estimated Value: $195,789 - $246,000
--
Bed
--
Bath
1,188
Sq Ft
$195/Sq Ft
Est. Value
About This Home
This home is located at 4310 Amon Ct, Pennsauken, NJ 08110 and is currently estimated at $231,697, approximately $195 per square foot. 4310 Amon Ct is a home located in Camden County with nearby schools including Pennsauken High School, St. Peter Elementary School, and St. Cecilia School.
Ownership History
Date
Name
Owned For
Owner Type
Purchase Details
Closed on
Sep 29, 1999
Sold by
Case Emma L Jones
Bought by
Byrd Casey T and Bird Nancy M
Current Estimated Value
Home Financials for this Owner
Home Financials are based on the most recent Mortgage that was taken out on this home.
Original Mortgage
$62,467
Outstanding Balance
$18,818
Interest Rate
7.8%
Mortgage Type
FHA
Estimated Equity
$212,879
Purchase Details
Closed on
Oct 15, 1993
Sold by
Hauptman Norman
Bought by
Jones Emma L
Create a Home Valuation Report for This Property
The Home Valuation Report is an in-depth analysis detailing your home's value as well as a comparison with similar homes in the area
Home Values in the Area
Average Home Value in this Area
Purchase History
| Date | Buyer | Sale Price | Title Company |
|---|---|---|---|
| Byrd Casey T | $62,500 | -- | |
| Jones Emma L | $54,000 | -- |
Source: Public Records
Mortgage History
| Date | Status | Borrower | Loan Amount |
|---|---|---|---|
| Open | Byrd Casey T | $62,467 |
Source: Public Records
Tax History Compared to Growth
Tax History
| Year | Tax Paid | Tax Assessment Tax Assessment Total Assessment is a certain percentage of the fair market value that is determined by local assessors to be the total taxable value of land and additions on the property. | Land | Improvement |
|---|---|---|---|---|
| 2025 | $4,139 | $183,700 | $42,300 | $141,400 |
| 2024 | $4,059 | $95,100 | $16,800 | $78,300 |
| 2023 | $4,059 | $95,100 | $16,800 | $78,300 |
| 2022 | $3,670 | $95,100 | $16,800 | $78,300 |
| 2021 | $3,769 | $95,100 | $16,800 | $78,300 |
| 2020 | $3,376 | $95,100 | $16,800 | $78,300 |
| 2019 | $3,415 | $95,100 | $16,800 | $78,300 |
| 2018 | $3,433 | $95,100 | $16,800 | $78,300 |
| 2017 | $3,440 | $95,100 | $16,800 | $78,300 |
| 2016 | $3,378 | $95,100 | $16,800 | $78,300 |
| 2015 | $3,479 | $95,100 | $16,800 | $78,300 |
| 2014 | $3,560 | $64,000 | $10,700 | $53,300 |
Source: Public Records
Map
Nearby Homes