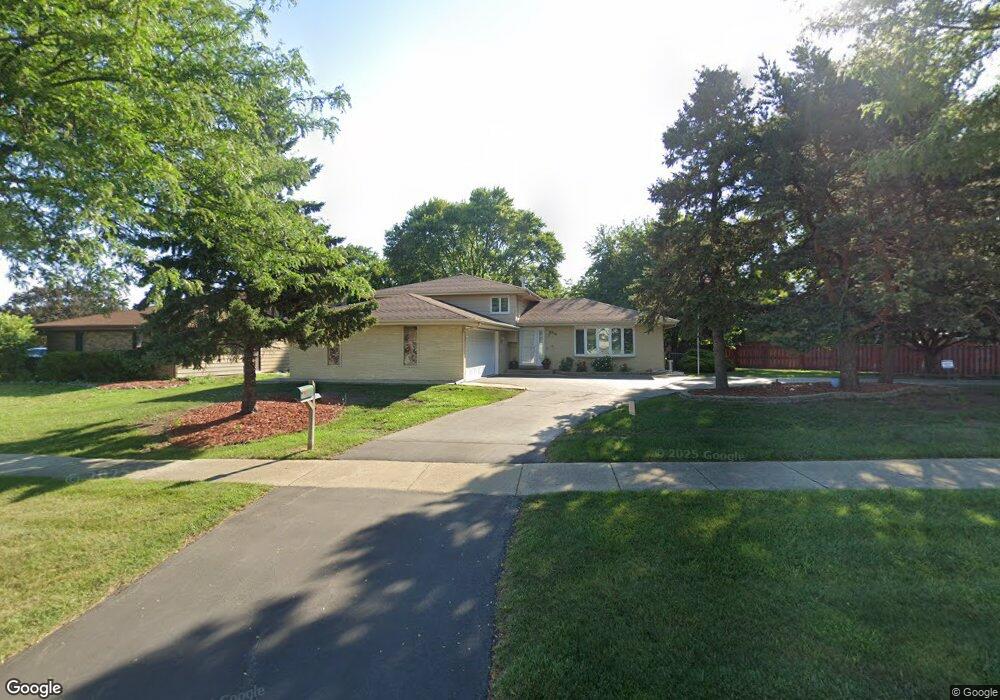
4310 E Frontage Rd Rolling Meadows, IL 60008
Busse Woods NeighborhoodEstimated Value: $346,000 - $403,493
3
Beds
2
Baths
1,065
Sq Ft
$351/Sq Ft
Est. Value
About This Home
This home is located at 4310 E Frontage Rd, Rolling Meadows, IL 60008 and is currently estimated at $374,123, approximately $351 per square foot. 4310 E Frontage Rd is a home located in Cook County with nearby schools including Willow Bend Elementary School, Carl Sandburg Junior High School, and Rolling Meadows High School.
Ownership History
Date
Name
Owned For
Owner Type
Purchase Details
Closed on
Jun 30, 2020
Sold by
Gigovski Mile and Gigovski Mirjana
Bought by
Gigovski Mirjana and Gigovski Mile
Current Estimated Value
Purchase Details
Closed on
Jan 24, 1998
Sold by
Gigovski Mile and Gigovski Virjana
Bought by
Gogovski Mile and Gigovski Mirjana
Home Financials for this Owner
Home Financials are based on the most recent Mortgage that was taken out on this home.
Original Mortgage
$70,000
Interest Rate
7.27%
Purchase Details
Closed on
May 31, 1995
Sold by
Mcaskill Sophia B
Bought by
Gigovski Mile and Gigovski Mirjana
Home Financials for this Owner
Home Financials are based on the most recent Mortgage that was taken out on this home.
Original Mortgage
$135,000
Interest Rate
8.26%
Create a Home Valuation Report for This Property
The Home Valuation Report is an in-depth analysis detailing your home's value as well as a comparison with similar homes in the area
Home Values in the Area
Average Home Value in this Area
Purchase History
| Date | Buyer | Sale Price | Title Company |
|---|---|---|---|
| Gigovski Mirjana | -- | Attorney | |
| Gogovski Mile | -- | -- | |
| Gigovski Mile | $200,000 | -- |
Source: Public Records
Mortgage History
| Date | Status | Borrower | Loan Amount |
|---|---|---|---|
| Closed | Gogovski Mile | $70,000 | |
| Closed | Gigovski Mile | $135,000 |
Source: Public Records
Tax History
| Year | Tax Paid | Tax Assessment Tax Assessment Total Assessment is a certain percentage of the fair market value that is determined by local assessors to be the total taxable value of land and additions on the property. | Land | Improvement |
|---|---|---|---|---|
| 2025 | $7,142 | $34,001 | $14,963 | $19,038 |
| 2024 | $7,142 | $31,000 | $12,600 | $18,400 |
| 2023 | $6,796 | $31,000 | $12,600 | $18,400 |
| 2022 | $6,796 | $31,000 | $12,600 | $18,400 |
| 2021 | $4,255 | $19,778 | $8,268 | $11,510 |
| 2020 | $4,282 | $19,778 | $8,268 | $11,510 |
| 2019 | $4,361 | $22,223 | $8,268 | $13,955 |
| 2018 | $5,440 | $24,218 | $7,087 | $17,131 |
| 2017 | $5,365 | $24,218 | $7,087 | $17,131 |
| 2016 | $5,487 | $24,218 | $7,087 | $17,131 |
| 2015 | $5,618 | $23,653 | $6,300 | $17,353 |
| 2014 | $5,514 | $23,653 | $6,300 | $17,353 |
| 2013 | $5,353 | $23,653 | $6,300 | $17,353 |
Source: Public Records
Map
Nearby Homes
- 399 Knollwood Ct
- 1813 Hemlock Place Unit 311
- 1931 Prairie Square Unit 1931
- 2830 Northampton Dr Unit A1
- 1912 Prairie Square Unit 309
- 1926 Prairie Square Unit 134
- 1926 Prairie Square Unit 210
- 1611 Waxwing Ct
- 3200 Thrush Ln
- 5001 Carriage Way Dr Unit 116
- 5000 Carriageway Dr Unit 305
- 5000 Carriageway Dr Unit 211
- 3712 Jay Ln
- 5201 Carriageway Dr Unit C317
- 2508 Algonquin Rd Unit 16
- 2504 Algonquin Rd Unit 14
- 3107 Falcon Ct W
- 3 Holyoke on Auburn
- 3135 Town Square Dr Unit 401
- 3135 Town Square Dr Unit 104
- 4403 Hawthorn Ln
- 4308 E Frontage Rd
- 4401 Hawthorn Ln
- 4405 Hawthorn Ln
- 4306 E Frontage Rd
- 4315 Hawthorne Ln
- 4315 Hawthorn Ln
- 4304 E Frontage Rd
- 4311 Hawthorn Ln
- 4402 Hawthorne Ln
- 4402 Hawthorn Ln
- 4404 Hawthorn Ln
- 4400 Hawthorn Ln
- 4406 Hawthorn Ln
- 4302 E Frontage Rd
- 4310 Hawthorn Ln
- 4309 Hawthorn Ln
- 3803 Central Rd
- 3607 Brookmeade Dr
- 3805 Central Rd
Your Personal Tour Guide
Ask me questions while you tour the home.