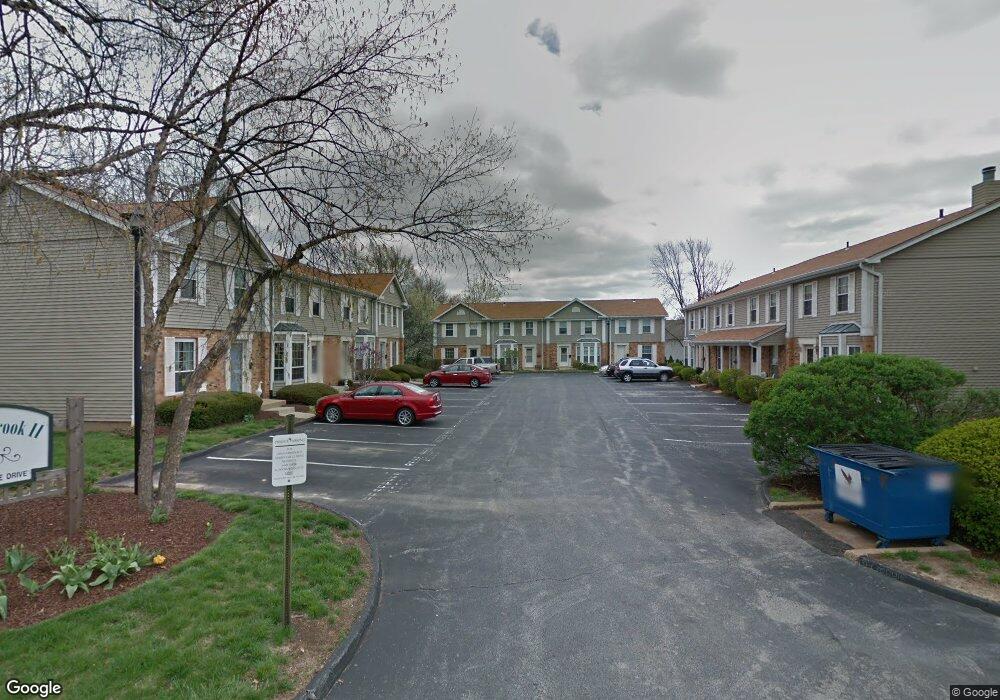
4310 Mersey Circle Dr Unit 10A Saint Louis, MO 63129
Mehlville NeighborhoodEstimated Value: $165,000 - $202,000
4
Beds
3
Baths
1,240
Sq Ft
$149/Sq Ft
Est. Value
About This Home
This home is located at 4310 Mersey Circle Dr Unit 10A, Saint Louis, MO 63129 and is currently estimated at $185,165, approximately $149 per square foot. 4310 Mersey Circle Dr Unit 10A is a home located in St. Louis County with nearby schools including Blades Elementary School, Bernard Middle School, and Oakville Senior High School.
Ownership History
Date
Name
Owned For
Owner Type
Purchase Details
Closed on
Sep 19, 2017
Sold by
Burton Ronald L
Bought by
Anderson Theodore and Wilderness Sharil
Current Estimated Value
Home Financials for this Owner
Home Financials are based on the most recent Mortgage that was taken out on this home.
Original Mortgage
$118,750
Outstanding Balance
$99,165
Interest Rate
3.9%
Mortgage Type
New Conventional
Estimated Equity
$86,000
Purchase Details
Closed on
Nov 19, 2008
Sold by
Advantage Properties Llc
Bought by
Burton Ronald L
Home Financials for this Owner
Home Financials are based on the most recent Mortgage that was taken out on this home.
Original Mortgage
$123,500
Interest Rate
5.98%
Mortgage Type
VA
Purchase Details
Closed on
Jun 12, 2008
Sold by
Boehmer Brian K
Bought by
Advantage Properties Llc
Create a Home Valuation Report for This Property
The Home Valuation Report is an in-depth analysis detailing your home's value as well as a comparison with similar homes in the area
Home Values in the Area
Average Home Value in this Area
Purchase History
| Date | Buyer | Sale Price | Title Company |
|---|---|---|---|
| Anderson Theodore | $125,000 | Title Partners Agency Llc | |
| Burton Ronald L | $123,500 | None Available | |
| Advantage Properties Llc | $83,917 | None Available |
Source: Public Records
Mortgage History
| Date | Status | Borrower | Loan Amount |
|---|---|---|---|
| Open | Anderson Theodore | $118,750 | |
| Previous Owner | Burton Ronald L | $123,500 |
Source: Public Records
Tax History Compared to Growth
Tax History
| Year | Tax Paid | Tax Assessment Tax Assessment Total Assessment is a certain percentage of the fair market value that is determined by local assessors to be the total taxable value of land and additions on the property. | Land | Improvement |
|---|---|---|---|---|
| 2025 | $1,695 | $31,880 | $7,770 | $24,110 |
| 2024 | $1,695 | $25,000 | $3,760 | $21,240 |
| 2023 | $1,674 | $25,000 | $3,760 | $21,240 |
| 2022 | $1,410 | $21,110 | $5,890 | $15,220 |
| 2021 | $1,365 | $21,110 | $5,890 | $15,220 |
| 2020 | $1,369 | $20,140 | $4,710 | $15,430 |
| 2019 | $1,365 | $20,140 | $4,710 | $15,430 |
| 2018 | $1,372 | $18,280 | $2,470 | $15,810 |
| 2017 | $1,370 | $18,280 | $2,470 | $15,810 |
| 2016 | $1,404 | $17,980 | $3,310 | $14,670 |
| 2015 | $1,290 | $17,980 | $3,310 | $14,670 |
| 2014 | $1,311 | $18,100 | $3,930 | $14,170 |
Source: Public Records
Map
Nearby Homes
- 1020 Mersey Bend Dr Unit 1D
- 1057 Mersey Bend Dr Unit C
- 4363 Tavistock Cir Unit 22C
- 9 Berview Cir Unit H
- 4376 Tavistock Cir Unit 18D
- 4248 Kingbolt Blvd Unit D
- 1084 Mersey Bend Dr Unit F
- 1 Berview Cir Unit B
- 1141 Sunbolt Dr Unit C
- 1076 Humber Cir
- 35 Berview Cir Unit E
- 4298 Chateau de Ville Dr Unit A
- 4347 Chateau de Ville Dr Unit G
- 4374 Forest de Ville Dr Unit 32A
- 4343 Chateau de Ville Dr
- 4353 Chateau de Ville Dr Unit D
- 4300 Forder Gardens Place Unit G
- 4314 Forder Gardens Place Unit B
- 1207 Saltash Ct
- 4329 Forder Gardens Place Unit A
- 4314 Mersey Circle Dr Unit 10C
- 4312 Mersey Circle Dr
- 4316 Mersey Circle Dr Unit 10D
- 4300 Mersey Circle Dr Unit 11A
- 4322 Mersey Circle Dr Unit 9C
- 4306 Mersey Circle Dr Unit 11D
- 4304 Mersey Circle Dr Unit 11C
- 4302 Mersey Circle Dr Unit 11B
- 4320 Mersey Circle Dr Unit 9A
- 4105 Forder Valley Dr
- 4326 Mersey Circle Dr Unit 9D
- 4324 Mersey Circle Dr Unit 9C
- 15 Berview Cir Unit H
- 15 Berview Cir Unit F
- 15 Berview Cir Unit B
- 15 Berview Cir Unit A
- 15 Berview Cir Unit E
- 15 Berview Cir Unit D
- 15 Berview Cir Unit C
- 4334 Mersey Bend Ct Unit 8C