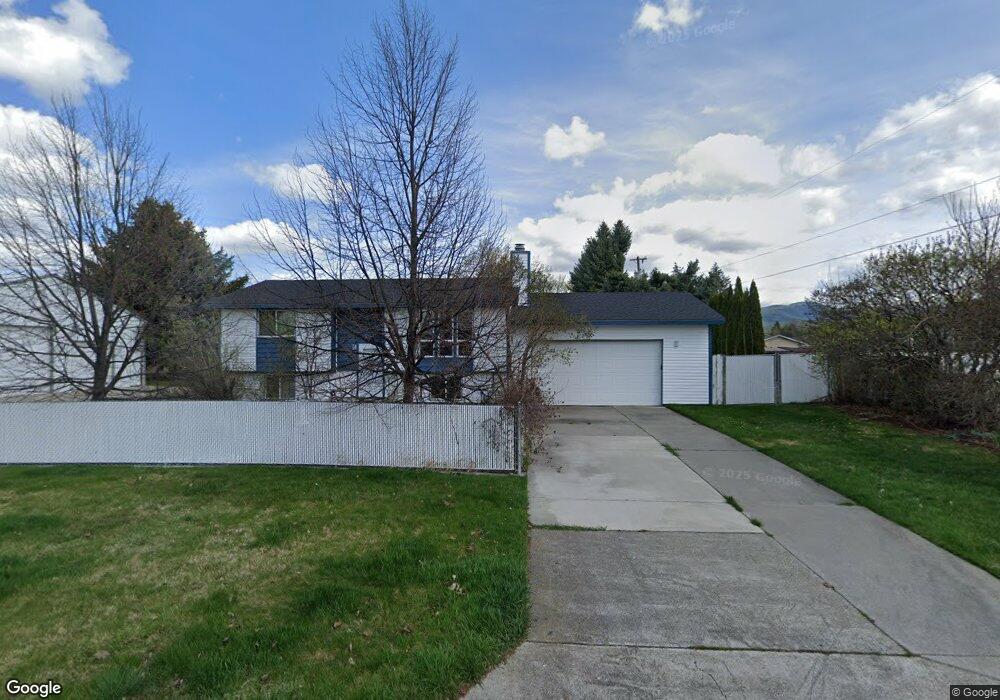
4310 N Martinson St Otis Orchards, WA 99027
Otis Orchards-East Farms NeighborhoodEstimated Value: $450,608 - $518,000
4
Beds
2
Baths
1,838
Sq Ft
$257/Sq Ft
Est. Value
About This Home
This home is located at 4310 N Martinson St, Otis Orchards, WA 99027 and is currently estimated at $472,652, approximately $257 per square foot. 4310 N Martinson St is a home located in Spokane County with nearby schools including Otis Orchards School, East Valley Middle School, and East Valley High School & Extension.
Ownership History
Date
Name
Owned For
Owner Type
Purchase Details
Closed on
May 27, 2010
Sold by
George Scott L and George Lisa A
Bought by
Johnson Mark A
Current Estimated Value
Home Financials for this Owner
Home Financials are based on the most recent Mortgage that was taken out on this home.
Original Mortgage
$204,300
Outstanding Balance
$137,325
Interest Rate
5.03%
Mortgage Type
VA
Estimated Equity
$335,327
Create a Home Valuation Report for This Property
The Home Valuation Report is an in-depth analysis detailing your home's value as well as a comparison with similar homes in the area
Home Values in the Area
Average Home Value in this Area
Purchase History
| Date | Buyer | Sale Price | Title Company |
|---|---|---|---|
| Johnson Mark A | $200,280 | Inland Professional Title |
Source: Public Records
Mortgage History
| Date | Status | Borrower | Loan Amount |
|---|---|---|---|
| Open | Johnson Mark A | $204,300 |
Source: Public Records
Tax History Compared to Growth
Tax History
| Year | Tax Paid | Tax Assessment Tax Assessment Total Assessment is a certain percentage of the fair market value that is determined by local assessors to be the total taxable value of land and additions on the property. | Land | Improvement |
|---|---|---|---|---|
| 2025 | $3,927 | $387,100 | $105,000 | $282,100 |
| 2024 | $3,927 | $396,400 | $94,500 | $301,900 |
| 2023 | $3,738 | $396,750 | $89,250 | $307,500 |
| 2022 | $3,510 | $380,650 | $78,750 | $301,900 |
| 2021 | $3,295 | $258,650 | $57,750 | $200,900 |
| 2020 | $3,168 | $235,450 | $57,750 | $177,700 |
| 2019 | $2,793 | $210,650 | $47,250 | $163,400 |
| 2018 | $2,805 | $197,250 | $47,250 | $150,000 |
| 2017 | $2,824 | $200,450 | $47,250 | $153,200 |
| 2016 | $2,608 | $187,100 | $42,000 | $145,100 |
| 2015 | $2,633 | $182,350 | $36,750 | $145,600 |
| 2014 | -- | $181,900 | $33,600 | $148,300 |
| 2013 | -- | $0 | $0 | $0 |
Source: Public Records
Map
Nearby Homes
- 4907 N Chase Rd
- 5325 N Vincent Rd
- 5407 N Chase Rd
- 24005 E Garland Ave
- 5718 N Martinson Rd
- 26610 E Queen Ave
- 24872 E Hawkstone Loop
- 5719 N Haye St
- 5816 N Canal Rd
- 2669 N Talon Ln
- 2669 Talon Ln
- 26301 E Rowan Ave
- 2725 Talon Ln
- 24672 E Hawkstone Loop
- 24846 E Coopers Hawk Ln
- 24672 Hawkstone Loop
- 24822 E Coopers Hawk Ln
- 24829 E Spotted Owl Ln
- 24821 Spotted Owl Ln
- 24821 E Spotted Owl Ln
- 25315 E Rich Ave
- 4313 N Martinson St
- 25405 E Rich Ave
- 4309 N Martinson St
- 25415 E Rich Ave
- 25316 E Rich Ave
- 25310 E Rich Ave
- 25404 E Rich Ave
- 25408 E Rich Ave
- 4317 N Canal Rd
- 4304 N Canal Rd
- 4312 N Canal Rd
- 4115 N Canal Rd
- 4222 N Canal Rd
- 4214 N Canal Rd
- 4204 N Canal Rd
- 4320 N Canal Rd
- 14617 E Longfellow Ave
- 25604 E Longfellow Ave
- 25421 E River Rd