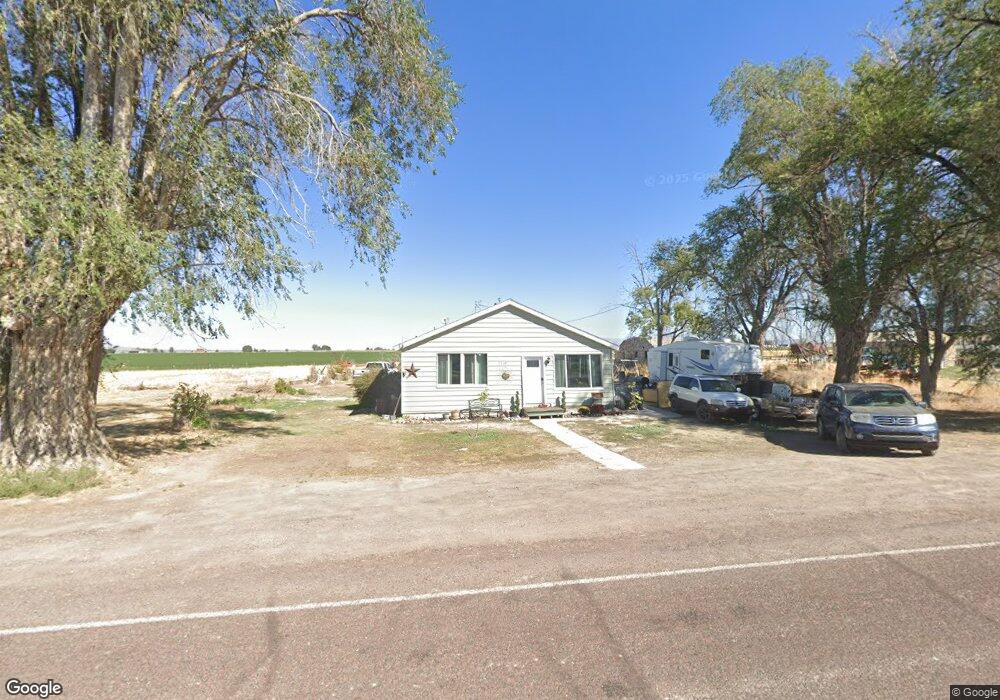
4310 W 500 N Fillmore, UT 84631
Estimated Value: $295,000 - $442,000
4
Beds
1
Bath
2,329
Sq Ft
$153/Sq Ft
Est. Value
About This Home
This home is located at 4310 W 500 N, Fillmore, UT 84631 and is currently estimated at $357,009, approximately $153 per square foot. 4310 W 500 N is a home located in Millard County.
Ownership History
Date
Name
Owned For
Owner Type
Purchase Details
Closed on
Mar 26, 2015
Bought by
Gomez Jose Luis and Gomez Marina
Current Estimated Value
Purchase Details
Closed on
Jun 18, 2009
Sold by
Christensen Randall O
Bought by
Lockhart John
Home Financials for this Owner
Home Financials are based on the most recent Mortgage that was taken out on this home.
Original Mortgage
$84,693
Outstanding Balance
$53,568
Interest Rate
4.79%
Mortgage Type
New Conventional
Estimated Equity
$303,441
Purchase Details
Closed on
Jan 29, 2007
Sold by
Christensen Verl H and Christensen Paul H
Bought by
Christensen Verl H
Create a Home Valuation Report for This Property
The Home Valuation Report is an in-depth analysis detailing your home's value as well as a comparison with similar homes in the area
Home Values in the Area
Average Home Value in this Area
Purchase History
| Date | Buyer | Sale Price | Title Company |
|---|---|---|---|
| Gomez Jose Luis | -- | First American Title Insur | |
| Lockhart John | -- | -- | |
| Christensen Verl H | -- | -- |
Source: Public Records
Mortgage History
| Date | Status | Borrower | Loan Amount |
|---|---|---|---|
| Open | Lockhart John | $84,693 |
Source: Public Records
Tax History Compared to Growth
Tax History
| Year | Tax Paid | Tax Assessment Tax Assessment Total Assessment is a certain percentage of the fair market value that is determined by local assessors to be the total taxable value of land and additions on the property. | Land | Improvement |
|---|---|---|---|---|
| 2024 | $1,002 | $126,711 | $13,750 | $112,961 |
| 2023 | $1,002 | $126,711 | $13,750 | $112,961 |
| 2022 | $781 | $74,818 | $13,750 | $61,068 |
| 2021 | $657 | $60,783 | $12,100 | $48,683 |
| 2020 | $589 | $55,174 | $12,100 | $43,074 |
| 2019 | $541 | $51,081 | $12,100 | $38,981 |
| 2018 | $527 | $51,081 | $12,100 | $38,981 |
| 2017 | $517 | $47,781 | $8,800 | $38,981 |
| 2016 | $493 | $47,781 | $8,800 | $38,981 |
| 2015 | $490 | $47,521 | $8,800 | $38,721 |
| 2014 | -- | $47,521 | $8,800 | $38,721 |
| 2013 | -- | $47,521 | $8,800 | $38,721 |
Source: Public Records
Map
Nearby Homes
- 7500 N 3900 Rd W
- 2000 N West Frontage I-15
- 3700 W 5800 N
- 561 N 150 E Unit 10
- 1615 W Sunflower Ln Unit 4
- 1565 W Sunflower Ln Unit 3
- 1765 W Sunflower Ln Unit 7
- 410 W 400 N
- 1100 S 725 Rd W
- 335 W 400 North St
- 2600 S 400 Rd W
- 225 W 200 St N
- 380 N 200 St W
- 625 N 100 St E Unit 20
- 390 N 100 W
- 190 W 400 St S
- 60 W 100 N
- 2155 N Cedar Mountain Rd
- 2835 N Cedar Mountain Rd
- 2505 N Cedar Mountain Rd