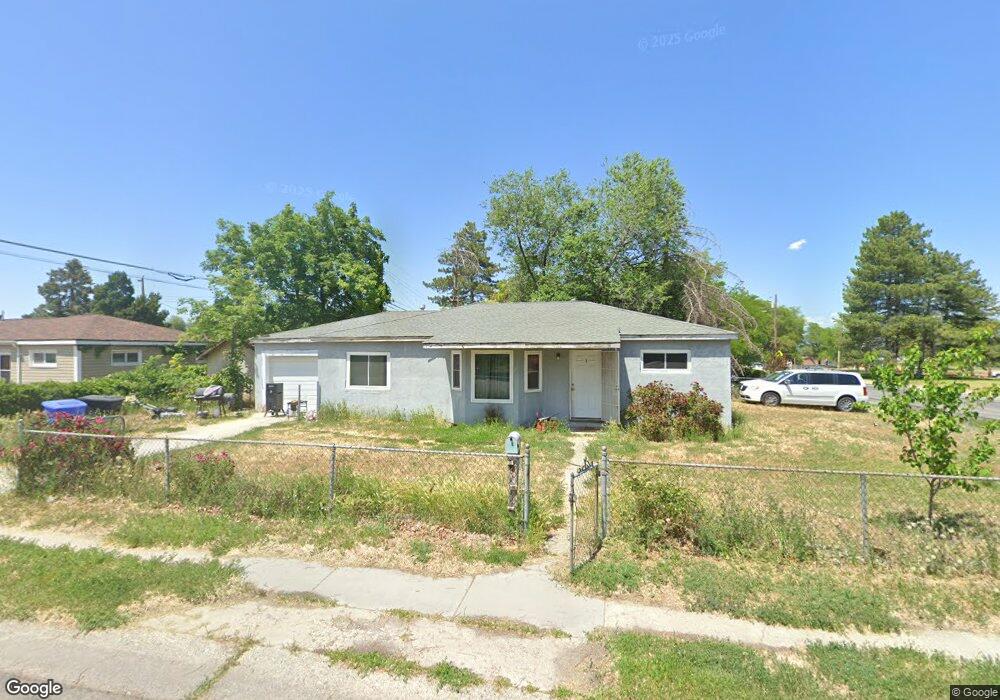
4310 W 5015 S Salt Lake City, UT 84118
Estimated Value: $364,000 - $390,711
3
Beds
2
Baths
1,176
Sq Ft
$319/Sq Ft
Est. Value
About This Home
This home is located at 4310 W 5015 S, Salt Lake City, UT 84118 and is currently estimated at $374,678, approximately $318 per square foot. 4310 W 5015 S is a home located in Salt Lake County with nearby schools including David Gourley Elementary School, Kearns Jr High School, and Kearns High School.
Ownership History
Date
Name
Owned For
Owner Type
Purchase Details
Closed on
May 6, 2025
Sold by
Travis Renee C and Lake Renee C
Bought by
Lake Renee C
Current Estimated Value
Home Financials for this Owner
Home Financials are based on the most recent Mortgage that was taken out on this home.
Original Mortgage
$100,000
Outstanding Balance
$99,646
Interest Rate
6.65%
Mortgage Type
Credit Line Revolving
Estimated Equity
$275,032
Purchase Details
Closed on
Dec 6, 2004
Sold by
Carter Kelly S
Bought by
Travis Renee C
Home Financials for this Owner
Home Financials are based on the most recent Mortgage that was taken out on this home.
Original Mortgage
$106,232
Interest Rate
5.64%
Mortgage Type
FHA
Create a Home Valuation Report for This Property
The Home Valuation Report is an in-depth analysis detailing your home's value as well as a comparison with similar homes in the area
Home Values in the Area
Average Home Value in this Area
Purchase History
| Date | Buyer | Sale Price | Title Company |
|---|---|---|---|
| Lake Renee C | -- | First American Title Insurance | |
| Lake Renee C | -- | First American Title Insurance | |
| Travis Renee C | -- | Metro National Title |
Source: Public Records
Mortgage History
| Date | Status | Borrower | Loan Amount |
|---|---|---|---|
| Open | Lake Renee C | $100,000 | |
| Closed | Lake Renee C | $100,000 | |
| Previous Owner | Travis Renee C | $106,232 |
Source: Public Records
Tax History Compared to Growth
Tax History
| Year | Tax Paid | Tax Assessment Tax Assessment Total Assessment is a certain percentage of the fair market value that is determined by local assessors to be the total taxable value of land and additions on the property. | Land | Improvement |
|---|---|---|---|---|
| 2025 | $2,567 | $326,300 | $84,100 | $242,200 |
| 2024 | $2,567 | $308,900 | $79,000 | $229,900 |
| 2023 | $2,567 | $279,100 | $75,900 | $203,200 |
| 2022 | $2,431 | $291,200 | $74,500 | $216,700 |
| 2021 | $2,228 | $239,200 | $57,300 | $181,900 |
| 2020 | $2,128 | $213,000 | $52,200 | $160,800 |
| 2019 | $2,103 | $210,500 | $49,200 | $161,300 |
| 2018 | $2,039 | $193,000 | $49,200 | $143,800 |
| 2017 | $1,535 | $166,900 | $49,200 | $117,700 |
| 2016 | $1,258 | $141,500 | $45,400 | $96,100 |
| 2015 | $1,174 | $116,200 | $55,400 | $60,800 |
| 2014 | $1,036 | $106,100 | $51,400 | $54,700 |
Source: Public Records
Map
Nearby Homes