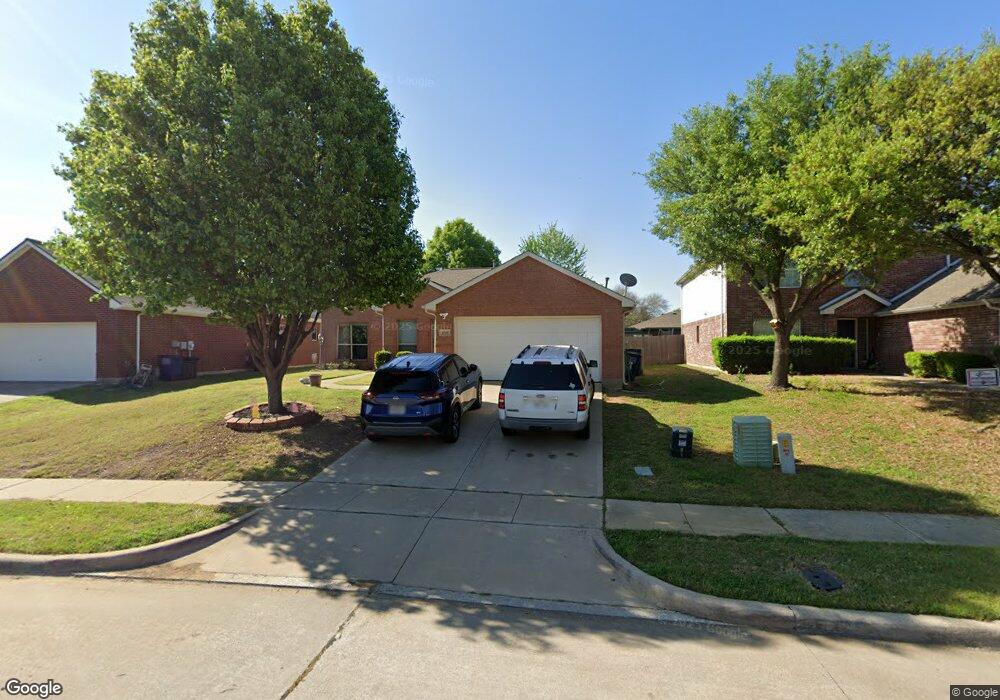
4310 Windmill Hill Cir Corinth, TX 76208
Estimated Value: $357,000 - $363,000
4
Beds
2
Baths
1,856
Sq Ft
$193/Sq Ft
Est. Value
About This Home
This home is located at 4310 Windmill Hill Cir, Corinth, TX 76208 and is currently estimated at $359,060, approximately $193 per square foot. 4310 Windmill Hill Cir is a home located in Denton County with nearby schools including Shady Shores Elementary School, Lake Dallas Middle School, and Lake Dallas High School.
Ownership History
Date
Name
Owned For
Owner Type
Purchase Details
Closed on
Mar 2, 2023
Sold by
Hettena Family 2009 Revocable Community
Bought by
Hurley Jerry D and Hurley Monica C
Current Estimated Value
Home Financials for this Owner
Home Financials are based on the most recent Mortgage that was taken out on this home.
Original Mortgage
$340,000
Outstanding Balance
$329,364
Interest Rate
6.15%
Mortgage Type
VA
Estimated Equity
$29,696
Purchase Details
Closed on
May 6, 2009
Sold by
Hettena Avi J
Bought by
Hettena Avi J and Tucker Kathleen
Purchase Details
Closed on
Jun 21, 2006
Sold by
Excel Custom Homes Inc
Bought by
Hettena Avi J
Home Financials for this Owner
Home Financials are based on the most recent Mortgage that was taken out on this home.
Original Mortgage
$112,200
Interest Rate
6.63%
Mortgage Type
Purchase Money Mortgage
Create a Home Valuation Report for This Property
The Home Valuation Report is an in-depth analysis detailing your home's value as well as a comparison with similar homes in the area
Home Values in the Area
Average Home Value in this Area
Purchase History
| Date | Buyer | Sale Price | Title Company |
|---|---|---|---|
| Hurley Jerry D | -- | -- | |
| Hettena Avi J | -- | None Available | |
| Hettena Avi J | -- | Fnt |
Source: Public Records
Mortgage History
| Date | Status | Borrower | Loan Amount |
|---|---|---|---|
| Open | Hurley Jerry D | $340,000 | |
| Previous Owner | Hettena Avi J | $112,200 |
Source: Public Records
Tax History Compared to Growth
Tax History
| Year | Tax Paid | Tax Assessment Tax Assessment Total Assessment is a certain percentage of the fair market value that is determined by local assessors to be the total taxable value of land and additions on the property. | Land | Improvement |
|---|---|---|---|---|
| 2025 | $5,279 | $353,300 | $94,703 | $258,597 |
| 2024 | $6,740 | $344,368 | $94,703 | $249,665 |
| 2023 | $5,629 | $340,000 | $94,703 | $245,297 |
| 2022 | $6,789 | $308,543 | $71,974 | $236,569 |
| 2021 | $5,967 | $253,555 | $49,246 | $204,309 |
| 2020 | $5,602 | $239,540 | $49,246 | $190,294 |
| 2019 | $5,995 | $247,152 | $49,246 | $197,906 |
| 2018 | $5,071 | $207,436 | $49,246 | $158,190 |
| 2017 | $4,654 | $186,139 | $49,246 | $136,893 |
| 2016 | $4,482 | $179,259 | $49,246 | $130,013 |
| 2015 | $3,651 | $158,840 | $49,246 | $109,594 |
| 2013 | -- | $136,656 | $34,093 | $102,563 |
Source: Public Records
Map
Nearby Homes
- 4303 Grassy Glen Dr
- 2104 Glen Manor Rd
- 4311 Wilmette Dr
- 731 River Oak Way
- 422 Oakwood Cir
- 775 Lacey Oaks Ln
- 337 Sweet Leaf Ln
- 4211 Creek Bend Ct
- 1909 Rocky Ct
- 339 Stately Oak Ln
- 786 Texas Oak Trail
- 328 Ashley Oak Ln
- 3608 Lynchburg Dr
- 737 Black Walnut Dr
- 2806 Wandering Oak Dr
- 223 Luna Ln
- 700 Oakridge Dr
- 119 Mustang Trail
- 416 Bronco Cir
- 3905 Park Wood Dr
- 4308 Windmill Hill Cir
- 4312 Windmill Hill Cir
- 4306 Windmill Hill Cir
- 4314 Windmill Hill Cir
- 4311 Wood Stone Cir
- 4309 Wood Stone Cir
- 4313 Wood Stone Cir
- 4307 Wood Stone Cir
- 4311 Windmill Hill Cir
- 4315 Wood Stone Cir
- 4304 Windmill Hill Cir
- 4309 Windmill Hill Cir
- 4316 Windmill Hill Cir
- 4313 Windmill Hill Cir
- 4307 Windmill Hill Cir
- 4305 Wood Stone Cir
- 4317 Wood Stone Cir
- 4302 Windmill Hill Cir
- 4315 Windmill Hill Cir
- 4305 Windmill Hill Cir