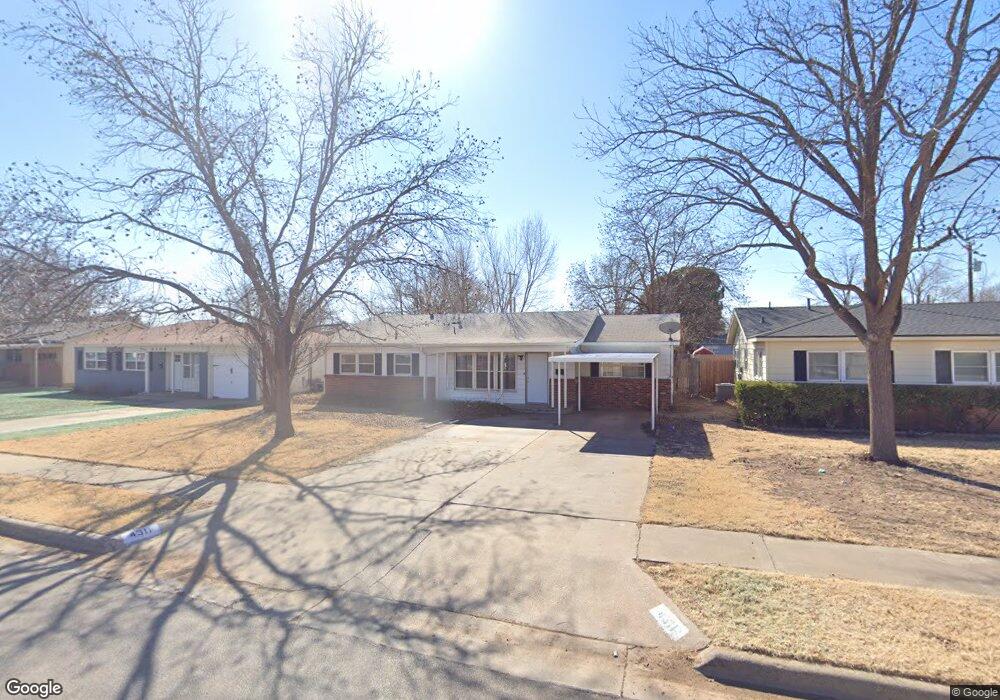
4311 29th St Lubbock, TX 79410
Maxey Park NeighborhoodEstimated Value: $170,000 - $205,000
4
Beds
2
Baths
--
Sq Ft
7,971
Sq Ft Lot
About This Home
This home is located at 4311 29th St, Lubbock, TX 79410 and is currently estimated at $190,971. 4311 29th St is a home located in Lubbock County with nearby schools including Overton Elementary School, Commander William C. McCool Academy, and Mackenzie Middle School.
Ownership History
Date
Name
Owned For
Owner Type
Purchase Details
Closed on
May 22, 2013
Sold by
Pitts Tom Kiser
Bought by
Sterling Creek Ventures Llc
Current Estimated Value
Purchase Details
Closed on
Oct 5, 2011
Sold by
Pitts Kelley and Pitts Jill
Bought by
Pitts Tom Kiser
Home Financials for this Owner
Home Financials are based on the most recent Mortgage that was taken out on this home.
Original Mortgage
$54,800
Interest Rate
4.17%
Mortgage Type
New Conventional
Create a Home Valuation Report for This Property
The Home Valuation Report is an in-depth analysis detailing your home's value as well as a comparison with similar homes in the area
Home Values in the Area
Average Home Value in this Area
Purchase History
| Date | Buyer | Sale Price | Title Company |
|---|---|---|---|
| Sterling Creek Ventures Llc | -- | Service Title | |
| Pitts Tom Kiser | -- | Stewart Title |
Source: Public Records
Mortgage History
| Date | Status | Borrower | Loan Amount |
|---|---|---|---|
| Previous Owner | Pitts Tom Kiser | $54,800 |
Source: Public Records
Tax History Compared to Growth
Tax History
| Year | Tax Paid | Tax Assessment Tax Assessment Total Assessment is a certain percentage of the fair market value that is determined by local assessors to be the total taxable value of land and additions on the property. | Land | Improvement |
|---|---|---|---|---|
| 2025 | $2,764 | $156,284 | $23,000 | $133,284 |
| 2024 | $2,764 | $152,203 | $23,000 | $129,203 |
| 2023 | $2,669 | $143,584 | $10,980 | $132,604 |
| 2022 | $2,466 | $121,823 | $10,980 | $110,843 |
| 2021 | $2,788 | $130,196 | $10,980 | $119,216 |
| 2020 | $2,518 | $115,784 | $10,980 | $104,804 |
| 2019 | $2,159 | $96,176 | $10,980 | $85,196 |
| 2018 | $2,040 | $90,766 | $10,980 | $79,786 |
| 2017 | $2,043 | $90,766 | $10,980 | $79,786 |
| 2016 | $1,917 | $85,164 | $10,980 | $74,184 |
| 2015 | $2,000 | $84,291 | $10,980 | $73,311 |
| 2014 | $2,000 | $89,945 | $5,400 | $84,545 |
Source: Public Records
Map
Nearby Homes