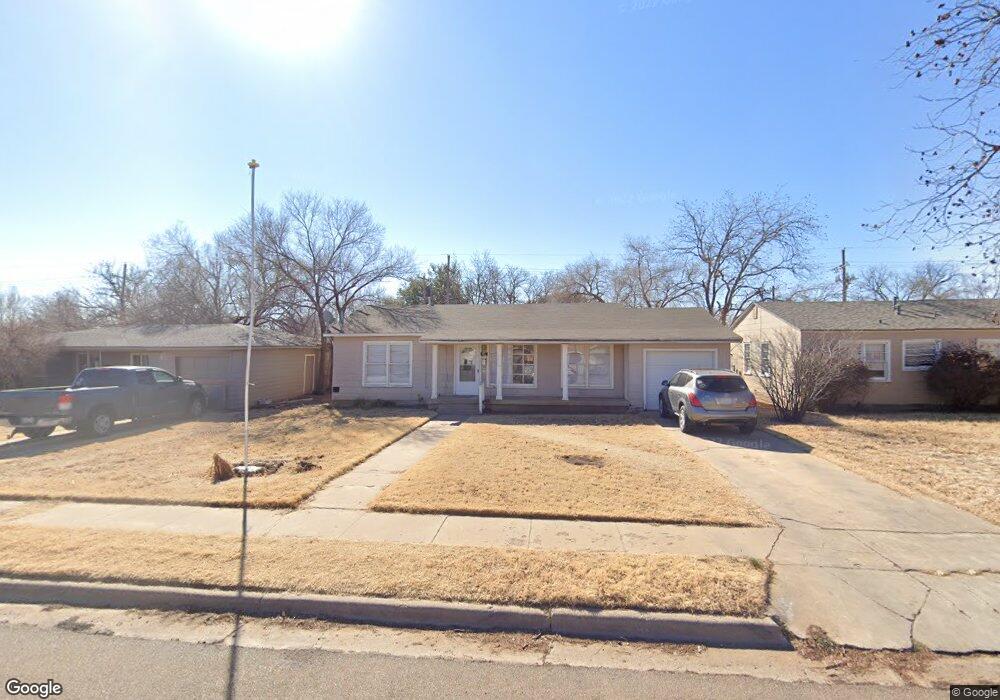
4311 31st St Lubbock, TX 79410
Maxey Park NeighborhoodEstimated Value: $154,934 - $163,000
3
Beds
1
Bath
1,353
Sq Ft
$117/Sq Ft
Est. Value
About This Home
This home is located at 4311 31st St, Lubbock, TX 79410 and is currently estimated at $158,734, approximately $117 per square foot. 4311 31st St is a home located in Lubbock County with nearby schools including Overton Elementary School, Mackenzie Middle School, and Coronado High School.
Ownership History
Date
Name
Owned For
Owner Type
Purchase Details
Closed on
Oct 31, 2007
Sold by
Ramsey Jason A
Bought by
Phillips Bryan H
Current Estimated Value
Purchase Details
Closed on
Dec 27, 2006
Sold by
Ramsey Jason R
Bought by
Phillips Bryan H
Purchase Details
Closed on
Dec 16, 1992
Sold by
Cartwright Troy G
Bought by
Phillips Bryan
Create a Home Valuation Report for This Property
The Home Valuation Report is an in-depth analysis detailing your home's value as well as a comparison with similar homes in the area
Home Values in the Area
Average Home Value in this Area
Purchase History
| Date | Buyer | Sale Price | Title Company |
|---|---|---|---|
| Phillips Bryan H | -- | None Available | |
| Phillips Bryan H | -- | None Available | |
| Phillips Bryan | -- | -- |
Source: Public Records
Tax History Compared to Growth
Tax History
| Year | Tax Paid | Tax Assessment Tax Assessment Total Assessment is a certain percentage of the fair market value that is determined by local assessors to be the total taxable value of land and additions on the property. | Land | Improvement |
|---|---|---|---|---|
| 2025 | $2,760 | $151,985 | $23,500 | $128,485 |
| 2024 | $28 | $151,985 | $23,500 | $128,485 |
| 2023 | $2,738 | $147,295 | $10,980 | $136,315 |
| 2022 | $2,714 | $134,055 | $10,980 | $123,075 |
| 2021 | $2,141 | $99,983 | $10,980 | $89,003 |
| 2020 | $2,015 | $92,680 | $10,980 | $81,700 |
| 2019 | $2,081 | $92,680 | $10,980 | $81,700 |
| 2018 | $2,083 | $92,680 | $10,980 | $81,700 |
| 2017 | $1,756 | $77,997 | $10,980 | $67,017 |
| 2016 | $1,756 | $77,997 | $10,980 | $67,017 |
| 2015 | $1,675 | $77,997 | $10,980 | $67,017 |
| 2014 | $1,675 | $75,321 | $5,400 | $69,921 |
Source: Public Records
Map
Nearby Homes