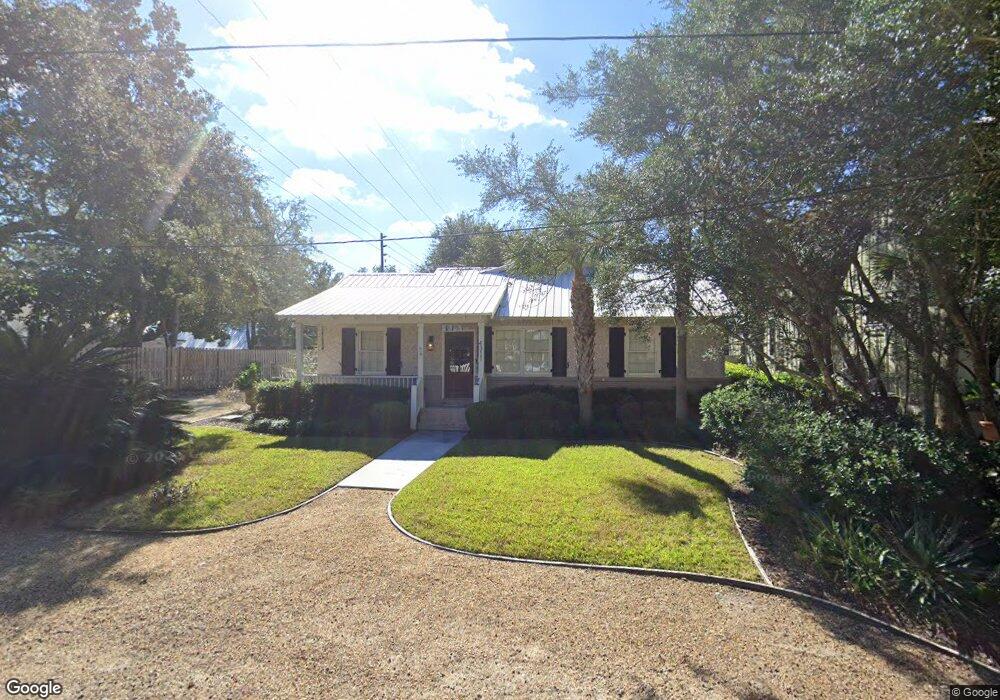
4311 7th St Saint Simons Island, GA 31522
Estimated Value: $1,346,000 - $1,566,000
3
Beds
3
Baths
1,664
Sq Ft
$894/Sq Ft
Est. Value
About This Home
This home is located at 4311 7th St, Saint Simons Island, GA 31522 and is currently estimated at $1,488,060, approximately $894 per square foot. 4311 7th St is a home located in Glynn County with nearby schools including St. Simons Elementary School, Glynn Middle School, and Glynn Academy.
Ownership History
Date
Name
Owned For
Owner Type
Purchase Details
Closed on
Nov 28, 2023
Sold by
Martin Anthony Keith
Bought by
Off Call Cottage Properties Llc
Current Estimated Value
Purchase Details
Closed on
Apr 9, 2020
Sold by
Martin Anthony K
Bought by
Martin Anthony K
Purchase Details
Closed on
Oct 13, 2017
Sold by
Schreiber Milton O
Bought by
Martin Anthony K and Martin Patricia C
Home Financials for this Owner
Home Financials are based on the most recent Mortgage that was taken out on this home.
Original Mortgage
$100,000
Interest Rate
3.78%
Mortgage Type
New Conventional
Purchase Details
Closed on
May 15, 2013
Sold by
Trinity Island Investors L
Bought by
Schreiber Milton O and Schreiber Sally F
Purchase Details
Closed on
Aug 10, 2012
Sold by
Anderson Robert Banks
Bought by
Trinity Island Investors Llc
Create a Home Valuation Report for This Property
The Home Valuation Report is an in-depth analysis detailing your home's value as well as a comparison with similar homes in the area
Home Values in the Area
Average Home Value in this Area
Purchase History
| Date | Buyer | Sale Price | Title Company |
|---|---|---|---|
| Off Call Cottage Properties Llc | -- | -- | |
| Martin Anthony K | -- | -- | |
| Martin Anthony K | $684,500 | -- | |
| Schreiber Milton O | $550,000 | -- | |
| Trinity Island Investors Llc | $300,000 | -- |
Source: Public Records
Mortgage History
| Date | Status | Borrower | Loan Amount |
|---|---|---|---|
| Previous Owner | Martin Anthony K | $100,000 |
Source: Public Records
Tax History Compared to Growth
Tax History
| Year | Tax Paid | Tax Assessment Tax Assessment Total Assessment is a certain percentage of the fair market value that is determined by local assessors to be the total taxable value of land and additions on the property. | Land | Improvement |
|---|---|---|---|---|
| 2025 | $9,610 | $383,200 | $268,240 | $114,960 |
| 2024 | $9,610 | $383,200 | $268,240 | $114,960 |
| 2023 | $11,081 | $445,840 | $312,200 | $133,640 |
| 2022 | $7,273 | $285,000 | $151,360 | $133,640 |
| 2021 | $7,431 | $282,520 | $151,360 | $131,160 |
| 2020 | $6,545 | $245,880 | $132,440 | $113,440 |
| 2019 | $6,545 | $245,880 | $132,440 | $113,440 |
| 2018 | $6,175 | $231,720 | $132,440 | $99,280 |
| 2017 | $6,100 | $228,840 | $132,440 | $96,400 |
| 2016 | $5,027 | $204,240 | $107,840 | $96,400 |
| 2015 | $5,047 | $204,240 | $107,840 | $96,400 |
| 2014 | $5,047 | $204,240 | $107,840 | $96,400 |
Source: Public Records
Map
Nearby Homes
- 4318 7th St
- 1909 Dixon Ln
- 1709 Dixon Ln
- 2022 Bruce Cir
- 1626 Bruce Dr
- 1604 Bruce Dr
- 4318 13th St
- 6 Coast Cottage Ln
- 17 Sea Oats Ln
- 5 and 7 Sea Oats Ln
- 1528 Ocean Blvd
- 1524 Wood Ave Unit 303
- 1524 Wood Ave Unit 215
- 1524 Wood Ave Unit 214
- 1524 Wood Ave Unit 314
- 1524 Wood Ave Unit 116
- 1495 Wood Ave
- 1460 Ocean Blvd Unit 101
- 1440 Ocean Blvd Unit 420
- 1440 Ocean Blvd Unit 437