


4311 County Street 2875 Rush Springs, OK 73082
Estimated payment $1,664/month
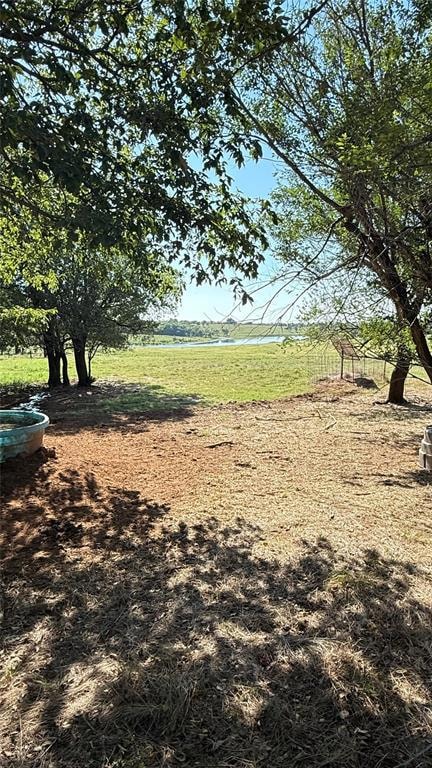
Highlights
- 80.27 Acre Lot
- Interior Lot
- Chain Link Fence
About This Lot
BEAUTIFUL ACREAGE JUST MINUTES FROM RUSH SPRINGS!
THIS PROPERTY INCLUDES A WATER WELL WITH A PUMP, IS FULLY FENCED, AND HAS MAIN ACCESS FROM COUNTY STREET. THE EXISTING HOUSE IS NOT LIVABLE AND WILL NEED TO BE TORN DOWN — THE VALUE IS IN THE LAND.
BUYERS ARE ENCOURAGED TO VERIFY ALL INFORMATION, INCLUDING SCHOOL DISTRICT.
Property Details
Property Type
- Land
Est. Annual Taxes
- $344
Lot Details
- 80.27 Acre Lot
- Property fronts a county road
- Chain Link Fence
- Interior Lot
Schools
- Rush Springs Elementary School
- Rush Springs Middle School
- Rush Springs High School
Map
Home Values in the Area
Average Home Value in this Area
Tax History
| Year | Tax Paid | Tax Assessment Tax Assessment Total Assessment is a certain percentage of the fair market value that is determined by local assessors to be the total taxable value of land and additions on the property. | Land | Improvement |
|---|---|---|---|---|
| 2024 | $344 | $3,848 | $2,413 | $1,435 |
| 2023 | $344 | $3,736 | $2,503 | $1,233 |
| 2022 | $320 | $3,627 | $2,328 | $1,299 |
| 2021 | $313 | $3,523 | $2,233 | $1,290 |
| 2020 | $307 | $3,420 | $2,184 | $1,236 |
| 2019 | $295 | $3,320 | $1,990 | $1,330 |
| 2018 | $276 | $3,223 | $1,952 | $1,271 |
| 2017 | $266 | $3,130 | $1,902 | $1,228 |
| 2016 | $242 | $3,038 | $1,823 | $1,215 |
| 2015 | $249 | $2,950 | $1,730 | $1,220 |
| 2014 | $249 | $2,864 | $1,613 | $1,251 |
Property History
| Date | Event | Price | Change | Sq Ft Price |
|---|---|---|---|---|
| 08/18/2025 08/18/25 | For Sale | $300,000 | -- | -- |
Purchase History
| Date | Type | Sale Price | Title Company |
|---|---|---|---|
| Warranty Deed | -- | -- |
Source: MLSOK
MLS Number: 1186494
APN: 0000-06-03N-06W-1-001-00
Disclaimer: Certain information contained herein is derived from information provided by parties other than Homes.com. All information provided is deemed reliable, but is not guaranteed to be accurate and should be independently verified.
![]() IDX information is provided exclusively for personal, non-commercial use, and may not be used for any purpose other than to identify prospective properties consumers may be interested in purchasing.
IDX information is provided exclusively for personal, non-commercial use, and may not be used for any purpose other than to identify prospective properties consumers may be interested in purchasing.
Information is deemed reliable but not guaranteed.
This information is not verified for authenticity or accuracy, is not guaranteed and may not reflect all real estate activity in the market.
Copyright 2025 MLSOK, Inc. All rights reserved.
- 439* 439* Cr 2946
- 4050 4050 Cs 2780
- 4004 4004 Cs 2800
- 1021 Cox City Rd
- 4484 N2850 Rd
- 993 Cox City Rd
- 1382 Cr 1590
- 937 Cox City Rd
- 1884 Cox City Rd
- 1008 County Road 1580
- 956 Cr 1530
- 0 S 5th St
- 607 Comanche Ave
- 25246 Oklahoma 17
- 111 N 5th St
- 701 W Comanche Ave
- 0 Highway 81
- 128 128 W Cool Springs
- HWY 81 Highway 81
- Hwy 81
