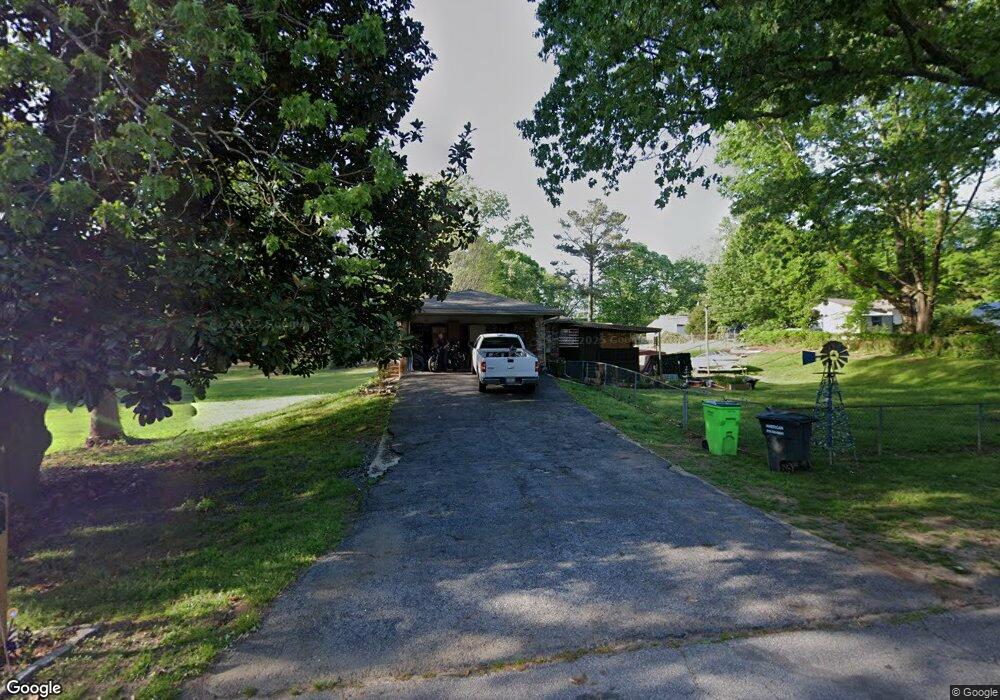
4311 Crabapple Trail Austell, GA 30106
Estimated Value: $274,000 - $325,000
3
Beds
2
Baths
1,818
Sq Ft
$162/Sq Ft
Est. Value
About This Home
This home is located at 4311 Crabapple Trail, Austell, GA 30106 and is currently estimated at $293,955, approximately $161 per square foot. 4311 Crabapple Trail is a home located in Cobb County with nearby schools including Clarkdale Elementary School, Cooper Middle School, and South Cobb High School.
Ownership History
Date
Name
Owned For
Owner Type
Purchase Details
Closed on
Nov 8, 2011
Sold by
Southern Specialty Propert
Bought by
Hyde Kenneth R and Hyde Tamera L
Current Estimated Value
Purchase Details
Closed on
Oct 14, 2011
Sold by
Secretary Of Housing And U
Bought by
Southern Specialty Properties
Purchase Details
Closed on
Aug 3, 2010
Sold by
Wells Fargo Bk Na
Bought by
Hud-Housing Of Urban Dev
Purchase Details
Closed on
Jul 29, 2002
Sold by
Kramer Lori M
Bought by
Chavez Jose A
Home Financials for this Owner
Home Financials are based on the most recent Mortgage that was taken out on this home.
Original Mortgage
$128,702
Interest Rate
6.52%
Mortgage Type
FHA
Purchase Details
Closed on
Jun 29, 1995
Sold by
Shelnutt Bobby W
Bought by
Dobson Geraldine E
Create a Home Valuation Report for This Property
The Home Valuation Report is an in-depth analysis detailing your home's value as well as a comparison with similar homes in the area
Home Values in the Area
Average Home Value in this Area
Purchase History
| Date | Buyer | Sale Price | Title Company |
|---|---|---|---|
| Hyde Kenneth R | $29,000 | -- | |
| Southern Specialty Properties | $16,000 | -- | |
| Hud-Housing Of Urban Dev | -- | -- | |
| Wells Fargo Bk Na | $133,545 | -- | |
| Chavez Jose A | $129,800 | -- | |
| Dobson Geraldine E | $78,400 | -- |
Source: Public Records
Mortgage History
| Date | Status | Borrower | Loan Amount |
|---|---|---|---|
| Previous Owner | Chavez Jose A | $128,702 | |
| Closed | Dobson Geraldine E | $0 |
Source: Public Records
Tax History Compared to Growth
Tax History
| Year | Tax Paid | Tax Assessment Tax Assessment Total Assessment is a certain percentage of the fair market value that is determined by local assessors to be the total taxable value of land and additions on the property. | Land | Improvement |
|---|---|---|---|---|
| 2025 | $2,973 | $98,668 | $16,000 | $82,668 |
| 2024 | $2,975 | $98,668 | $16,000 | $82,668 |
| 2023 | $2,975 | $98,668 | $16,000 | $82,668 |
| 2022 | $2,419 | $79,716 | $16,000 | $63,716 |
| 2021 | $1,955 | $64,400 | $10,400 | $54,000 |
| 2020 | $1,955 | $64,400 | $10,400 | $54,000 |
| 2019 | $1,955 | $64,400 | $10,400 | $54,000 |
| 2018 | $1,423 | $46,884 | $8,000 | $38,884 |
| 2017 | $1,348 | $46,884 | $8,000 | $38,884 |
| 2016 | $931 | $32,368 | $6,400 | $25,968 |
| 2015 | $868 | $29,464 | $6,400 | $23,064 |
| 2014 | $639 | $21,516 | $0 | $0 |
Source: Public Records
Map
Nearby Homes
- 2965 Dr
- 4099 Bunker Dr SW
- 2881 Golden Club Bend
- 4160 Ewing Rd
- 2774 Eloquent Ln
- 3989 Flint Hill Rd
- 2473 Greenside Ct
- 2867 Ash St SW
- 4550 Glory Dr
- 4280 Creek Crest Trail
- 2539 Dogwood Hills Ct
- 2402 Greenside Ct
- 3832 Abbott Ln Unit 1
- 3916 Abbott Way Unit 2
- 4462 Wesley Way
- 3807 Abbott Ln SW Unit 15
- 2300 Anderson Mill Rd
- 3237 Abbott Dr SW Unit 7
- 3235 Abbott Dr Unit 7
- 3233 Abbott Dr Unit 7
- 4301 Crabapple Trail
- 2916 Chestnut Grove Dr
- 2945 Chestnut Grove Dr
- 2923 Chestnut Grove Dr
- 2935 Chestnut Grove Dr
- 4291 Crabapple Trail
- 4302 Chestnut Grove Ln
- 2957 Chestnut Grove Dr
- 2962 Chestnut Grove Dr
- 2911 Chestnut Grove Dr
- 2996 Chestnut Cir
- 4288 Crabapple Trail
- 2969 Chestnut Grove Dr
- 2901 Chestnut Grove Dr
- 4273 Crabapple Trail
- 4272 Chestnut Grove Ln
- 2890 Chestnut Grove Dr
- 2820 Golden Club Bend Unit 1
- 2828 Golden Club Bend Unit 1
- 2816 Golden Club Bend