4311 Herring St Langley, WA 98260
Estimated Value: $500,000 - $675,000
3
Beds
1
Bath
1,344
Sq Ft
$424/Sq Ft
Est. Value
About This Home
This home is located at 4311 Herring St, Langley, WA 98260 and is currently estimated at $569,234, approximately $423 per square foot. 4311 Herring St is a home located in Island County with nearby schools including South Whidbey Elementary School, South Whidbey Middle School, and South Whidbey High School.
Ownership History
Date
Name
Owned For
Owner Type
Purchase Details
Closed on
Dec 13, 2017
Sold by
Moss River
Bought by
Moss Adam David
Current Estimated Value
Purchase Details
Closed on
Nov 14, 2017
Sold by
Moss River and Moss Adam David
Bought by
Moss Adam David and Moss River
Purchase Details
Closed on
Feb 3, 2017
Sold by
Moss River and Sandberg River
Bought by
Moss Adam David and Moss River
Purchase Details
Closed on
Dec 12, 2016
Sold by
Sandberg Richard P and Sandberg River
Bought by
Sandberg River
Create a Home Valuation Report for This Property
The Home Valuation Report is an in-depth analysis detailing your home's value as well as a comparison with similar homes in the area
Home Values in the Area
Average Home Value in this Area
Purchase History
| Date | Buyer | Sale Price | Title Company |
|---|---|---|---|
| Moss Adam David | -- | None Listed On Document | |
| Moss Adam David | -- | None Available | |
| Moss Adam David | -- | None Available | |
| Sandberg River | -- | None Available |
Source: Public Records
Tax History Compared to Growth
Tax History
| Year | Tax Paid | Tax Assessment Tax Assessment Total Assessment is a certain percentage of the fair market value that is determined by local assessors to be the total taxable value of land and additions on the property. | Land | Improvement |
|---|---|---|---|---|
| 2025 | $3,180 | $452,469 | $230,000 | $222,469 |
| 2024 | $3,007 | $440,241 | $215,000 | $225,241 |
| 2023 | $3,007 | $458,013 | $230,000 | $228,013 |
| 2022 | $2,666 | $418,982 | $210,000 | $208,982 |
| 2021 | $2,464 | $333,900 | $150,000 | $183,900 |
| 2020 | $2,287 | $314,019 | $135,000 | $179,019 |
| 2019 | $1,999 | $298,851 | $170,000 | $128,851 |
| 2018 | $1,625 | $259,224 | $130,000 | $129,224 |
| 2017 | $1,238 | $194,146 | $100,000 | $94,146 |
| 2016 | $1,211 | $161,004 | $60,000 | $101,004 |
| 2015 | -- | $152,316 | $50,000 | $102,316 |
| 2013 | -- | $137,143 | $50,000 | $87,143 |
Source: Public Records
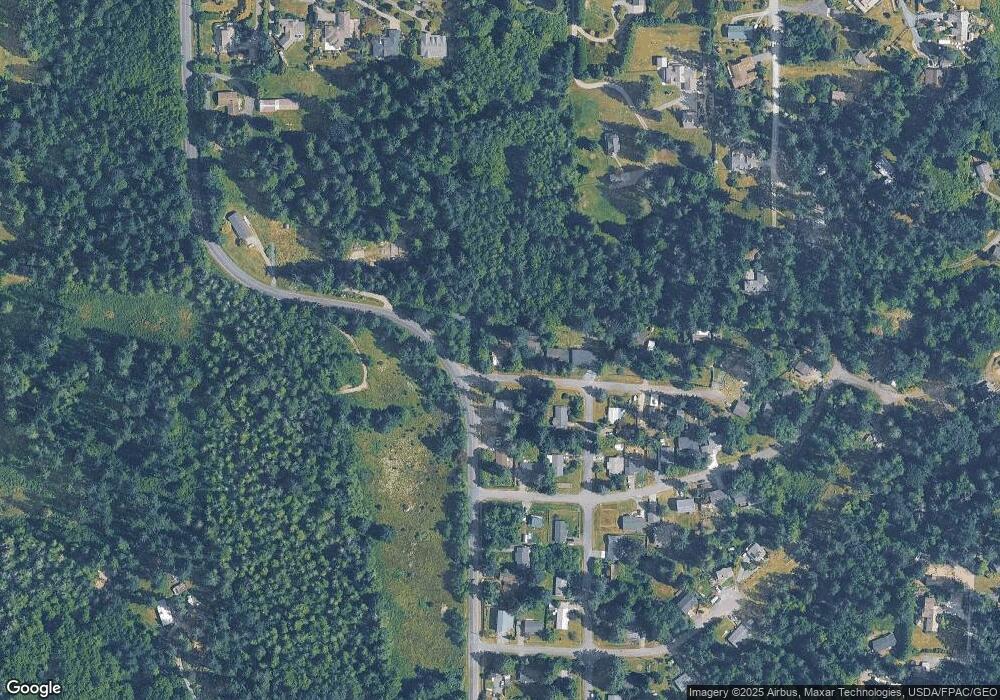
Map
Nearby Homes
- 4979 Blue Lady Ln
- 0 XXX Waterside Ln
- 4773 Whale Walk
- 967 Edgecliff Dr
- 5249 S Fallen Leaf Ln
- 0 XXX Sandy Point Rd
- 881 Cork Ln
- 808 Woodsong Ln
- 321 Edgecliff Dr
- 5474 Wilkinson Rd
- 566 Creekside Terrace Unit 101
- 730 Gleason Ln
- 249 Cascade Ave
- 300 Cottage Ln Unit 1
- 683 3rd St Unit 1(A)
- 624 A, B & C 2nd St
- 0 Captain Vancouver Dr Unit NWM2442158
- 0 Primavera Place
- 11652 State Route 525
- 42 M Cascade Dr
- 4313 Herring St
- 4317 Herring St
- 5019 Wilkinson Rd
- 4321 Herring St
- 5020 Hodges Ave
- 5029 Wilkinson Rd
- 5029 Wilkinson Rd
- 4313 Douglas St
- 5030 Hodges Ave
- 5021 Hodges Ave
- 4335 Herring St
- 5025 Hodges Ave
- 18 E Herring St
- 0 Herring St
- 8 Herring St
- 10 Herring St
- 0 Herring St Unit NWM1450598
- 4338 Herring St
- 4332 E Douglas St
- 4347 Herring St