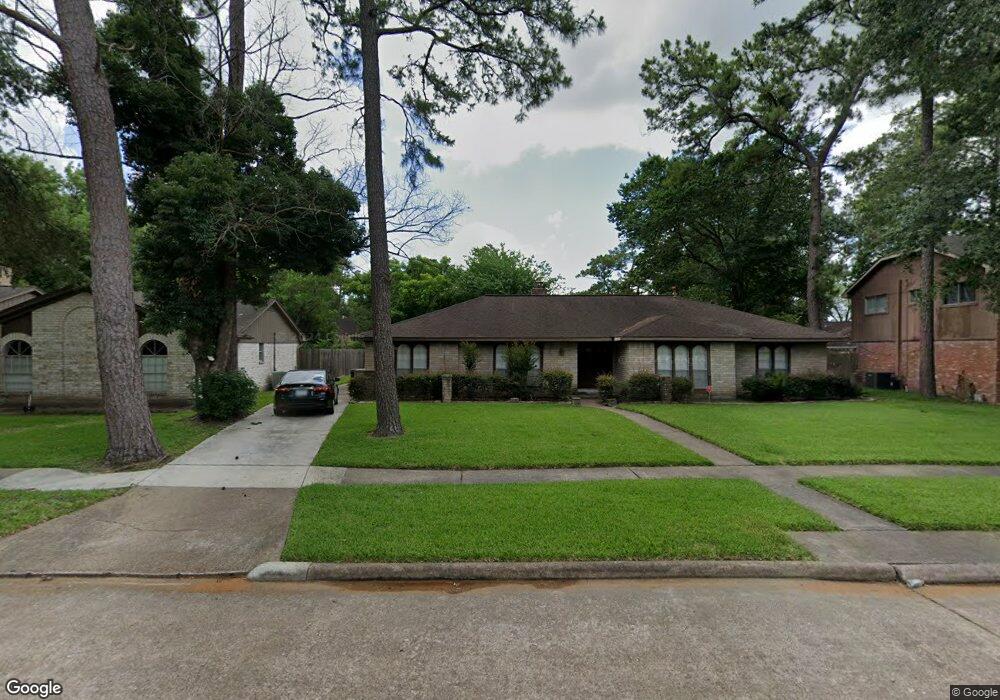
4311 Littleberry Rd Houston, TX 77088
Greater Inwood NeighborhoodEstimated Value: $270,000 - $314,673
4
Beds
3
Baths
2,756
Sq Ft
$106/Sq Ft
Est. Value
About This Home
This home is located at 4311 Littleberry Rd, Houston, TX 77088 and is currently estimated at $290,918, approximately $105 per square foot. 4311 Littleberry Rd is a home located in Harris County with nearby schools including Stovall School, Caraway Intermediate School, and Caraway Elementary School.
Ownership History
Date
Name
Owned For
Owner Type
Purchase Details
Closed on
Dec 21, 2007
Sold by
Bank Of New York
Bought by
Callier Pennington Ida M
Current Estimated Value
Home Financials for this Owner
Home Financials are based on the most recent Mortgage that was taken out on this home.
Original Mortgage
$100,500
Outstanding Balance
$63,382
Interest Rate
6.23%
Mortgage Type
Purchase Money Mortgage
Estimated Equity
$227,536
Purchase Details
Closed on
Mar 6, 2007
Sold by
Drew Anthony and Drew Michelle
Bought by
Bank Of New York and Certificateholders Cwabs Inc Asset Backe
Purchase Details
Closed on
Jul 1, 2003
Sold by
Devilla Guillermo and Devilla Gloria
Bought by
Wells Fargo Bank Minnesota Na and Structured Asset Securities Corp Amortiz
Purchase Details
Closed on
Jul 10, 2002
Sold by
Reid Martha L and Reid Martha Lanier
Bought by
Devilla Guillermo
Home Financials for this Owner
Home Financials are based on the most recent Mortgage that was taken out on this home.
Original Mortgage
$123,200
Interest Rate
8.7%
Create a Home Valuation Report for This Property
The Home Valuation Report is an in-depth analysis detailing your home's value as well as a comparison with similar homes in the area
Home Values in the Area
Average Home Value in this Area
Purchase History
| Date | Buyer | Sale Price | Title Company |
|---|---|---|---|
| Callier Pennington Ida M | -- | Texas American Title Company | |
| Bank Of New York | $124,850 | None Available | |
| Wells Fargo Bank Minnesota Na | $128,549 | -- | |
| Devilla Guillermo | -- | American Title Co |
Source: Public Records
Mortgage History
| Date | Status | Borrower | Loan Amount |
|---|---|---|---|
| Open | Callier Pennington Ida M | $100,500 | |
| Previous Owner | Devilla Guillermo | $123,200 | |
| Closed | Devilla Guillermo | $21,800 |
Source: Public Records
Tax History Compared to Growth
Tax History
| Year | Tax Paid | Tax Assessment Tax Assessment Total Assessment is a certain percentage of the fair market value that is determined by local assessors to be the total taxable value of land and additions on the property. | Land | Improvement |
|---|---|---|---|---|
| 2025 | $6,564 | $275,865 | $55,902 | $219,963 |
| 2024 | $6,564 | $289,213 | $55,902 | $233,311 |
| 2023 | $6,564 | $316,890 | $55,902 | $260,988 |
| 2022 | $7,136 | $297,521 | $46,585 | $250,936 |
| 2021 | $6,193 | $246,564 | $46,585 | $199,979 |
| 2020 | $6,508 | $246,564 | $46,585 | $199,979 |
| 2019 | $5,850 | $211,400 | $24,690 | $186,710 |
| 2018 | $2,607 | $181,552 | $24,690 | $156,862 |
| 2017 | $4,706 | $181,552 | $24,690 | $156,862 |
| 2016 | $4,278 | $161,282 | $24,690 | $136,592 |
| 2015 | $1,772 | $161,282 | $24,690 | $136,592 |
| 2014 | $1,772 | $148,176 | $24,690 | $123,486 |
Source: Public Records
Map
Nearby Homes
- 4444 Victory Dr Unit 1311
- 4444 Victory Dr Unit 1108
- 4306 Saratoga Dr
- 4206 Saratoga Dr
- 4015 Black Locust Dr
- 0 Maple Hill Dr
- 7331 Athlone Dr
- 3919 Badger Forest Dr
- 7526 Antoine Dr
- 5514 Long Creek Ln
- 5606 Water Leaf Ln
- 5710 Council Grove Ln
- 7611 Athlone Dr
- 5639 Council Grove Ln
- 3711 Black Locust Dr
- 5907 Darkwood Dr
- 5519 Council Grove Ln
- 7705 Inwood Grove Ln
- 7707 Inwood Grove Ln
- 7816 Inwood Grove Ln
- 4315 Littleberry Rd
- 4307 Littleberry Rd
- 4310 Birchcroft Dr
- 4306 Birchcroft Dr
- 4319 Littleberry Rd
- 4303 Littleberry Rd
- 4314 Birchcroft Dr
- 4302 Birchcroft Dr
- 4310 Littleberry Rd
- 4314 Littleberry Rd
- 4306 Littleberry Rd
- 4318 Birchcroft Dr
- 4214 Butternut Ct
- 4318 Littleberry Rd
- 4227 Littleberry Rd
- 4323 Littleberry Rd
- 4302 Littleberry Rd
- 4210 Butternut Ct
- 4322 Birchcroft Dr
- 4322 Littleberry Rd