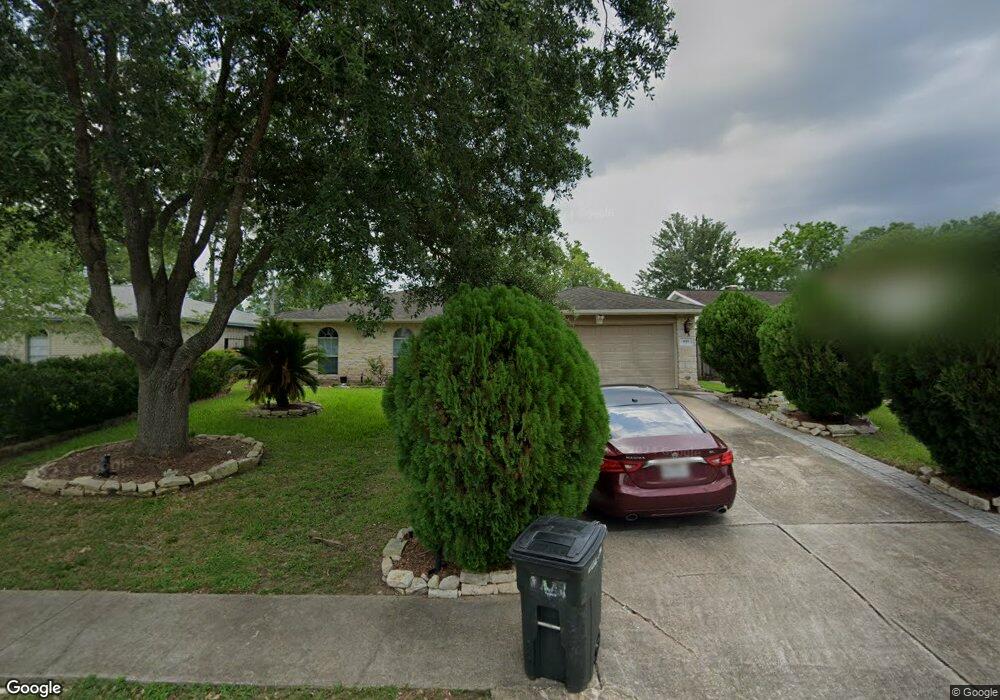
4311 Saffron Ln Friendswood, TX 77546
Estimated Value: $273,855 - $291,000
3
Beds
2
Baths
1,615
Sq Ft
$174/Sq Ft
Est. Value
About This Home
This home is located at 4311 Saffron Ln, Friendswood, TX 77546 and is currently estimated at $281,464, approximately $174 per square foot. 4311 Saffron Ln is a home located in Harris County with nearby schools including Wedgewood Elementary School, Brookside Intermediate School, and Clear Brook High School.
Ownership History
Date
Name
Owned For
Owner Type
Purchase Details
Closed on
Jan 18, 2006
Sold by
Herrera Jose M
Bought by
Escobar Jose G and Escobar Griselda J
Current Estimated Value
Home Financials for this Owner
Home Financials are based on the most recent Mortgage that was taken out on this home.
Original Mortgage
$89,600
Outstanding Balance
$61,135
Interest Rate
10.2%
Mortgage Type
Stand Alone First
Estimated Equity
$220,329
Purchase Details
Closed on
Jun 25, 1999
Sold by
Partridge Lloyd and Wood George
Bought by
Escobar Jose G and Escobar Griselda J
Home Financials for this Owner
Home Financials are based on the most recent Mortgage that was taken out on this home.
Original Mortgage
$79,859
Interest Rate
7.21%
Mortgage Type
FHA
Create a Home Valuation Report for This Property
The Home Valuation Report is an in-depth analysis detailing your home's value as well as a comparison with similar homes in the area
Home Values in the Area
Average Home Value in this Area
Purchase History
| Date | Buyer | Sale Price | Title Company |
|---|---|---|---|
| Escobar Jose G | -- | Fidelity National Title | |
| Escobar Jose G | -- | -- |
Source: Public Records
Mortgage History
| Date | Status | Borrower | Loan Amount |
|---|---|---|---|
| Open | Escobar Jose G | $89,600 | |
| Previous Owner | Escobar Jose G | $79,859 |
Source: Public Records
Tax History Compared to Growth
Tax History
| Year | Tax Paid | Tax Assessment Tax Assessment Total Assessment is a certain percentage of the fair market value that is determined by local assessors to be the total taxable value of land and additions on the property. | Land | Improvement |
|---|---|---|---|---|
| 2025 | $4,192 | $333,099 | $58,682 | $274,417 |
| 2024 | $4,192 | $305,919 | $58,682 | $247,237 |
| 2023 | $4,192 | $308,530 | $58,682 | $249,848 |
| 2022 | $5,012 | $275,326 | $58,682 | $216,644 |
| 2021 | $4,804 | $233,022 | $47,934 | $185,088 |
| 2020 | $4,744 | $207,571 | $33,742 | $173,829 |
| 2019 | $3,714 | $155,345 | $25,850 | $129,495 |
| 2018 | $668 | $131,518 | $27,797 | $103,721 |
| 2017 | $4,393 | $170,206 | $27,797 | $142,409 |
| 2016 | $3,997 | $164,997 | $27,797 | $137,200 |
| 2015 | $2,749 | $150,350 | $27,797 | $122,553 |
| 2014 | $2,749 | $131,137 | $23,164 | $107,973 |
Source: Public Records
Map
Nearby Homes
- 4311 Townes Forest Rd
- 16703 Hibiscus Ln
- 16903 Paint Rock Rd
- 4426 Saffron Ln
- 4430 Peridot Ln
- 5498 Apple Blossom Ln
- 4315 Ravine Dr
- 16607 David Glen Dr
- 4015 Ravine Dr
- 1303 Deepwood Dr
- 16907 Tibet Rd
- 17003 Tibet Rd
- 5323 Abercreek Ave
- 16303 Townes Rd
- 16510 Blackhawk Blvd
- 16926 Blackhawk Blvd
- 3836 Laura Leigh Dr
- 1201 Arbre Ln
- 5343 Royal Pkwy
- 16406 Blackhawk Blvd
- 4315 Saffron Ln
- 4307 Saffron Ln
- 4314 Peridot Ln
- 4303 Saffron Ln
- 4319 Saffron Ln
- 4318 Peridot Ln
- 4310 Peridot Ln
- 4322 Peridot Ln
- 4223 Saffron Ln
- 4310 Saffron Ln
- 4306 Peridot Ln
- 4306 Saffron Ln
- 4323 Saffron Ln
- 4302 Saffron Ln
- 4326 Peridot Ln
- 4318 Saffron Ln
- 4219 Saffron Ln
- 4222 Saffron Ln
- 4327 Saffron Ln
- 4302 Peridot Ln