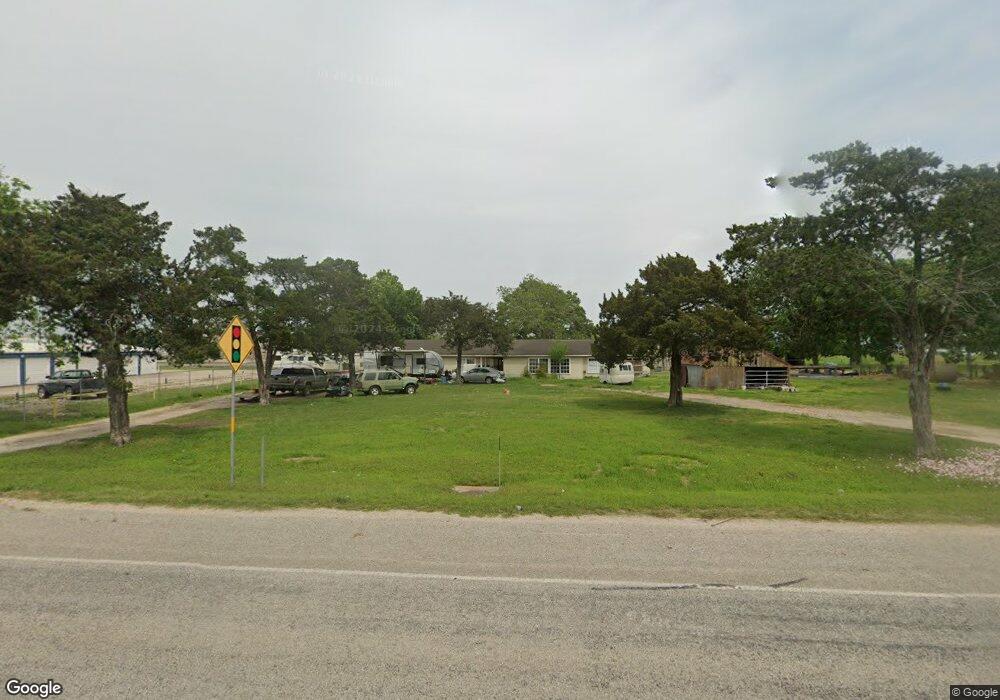
4311 Sargent Dr Bay City, TX 77414
Estimated Value: $250,000 - $409,000
--
Bed
1
Bath
2,818
Sq Ft
$106/Sq Ft
Est. Value
About This Home
This home is located at 4311 Sargent Dr, Bay City, TX 77414 and is currently estimated at $300,069, approximately $106 per square foot. 4311 Sargent Dr is a home located in Matagorda County with nearby schools including John H. Cherry Elementary School, Bay City Junior High School, and Bay City High School.
Create a Home Valuation Report for This Property
The Home Valuation Report is an in-depth analysis detailing your home's value as well as a comparison with similar homes in the area
Home Values in the Area
Average Home Value in this Area
Tax History Compared to Growth
Tax History
| Year | Tax Paid | Tax Assessment Tax Assessment Total Assessment is a certain percentage of the fair market value that is determined by local assessors to be the total taxable value of land and additions on the property. | Land | Improvement |
|---|---|---|---|---|
| 2024 | $59 | $253,630 | $48,350 | $205,280 |
| 2023 | $5,647 | $246,410 | $48,350 | $198,060 |
| 2022 | $5,883 | $223,770 | $48,350 | $175,420 |
| 2021 | $5,885 | $208,370 | $48,350 | $160,020 |
| 2020 | $5,565 | $182,080 | $48,350 | $133,730 |
| 2019 | $5,623 | $184,080 | $48,350 | $135,730 |
| 2018 | $5,541 | $188,080 | $48,350 | $139,730 |
| 2017 | $5,362 | $192,060 | $48,350 | $143,710 |
| 2016 | $5,362 | $192,060 | $48,350 | $143,710 |
| 2015 | -- | $185,590 | $48,350 | $137,240 |
| 2014 | -- | $167,190 | $48,350 | $118,840 |
Source: Public Records
Map
Nearby Homes
- 5148 Farm To Market Road 457
- 0000 Fm 457
- Tract 2 Cr 208
- Tract 4 Cr 208
- Tract 3 Cr 208
- Tract 5 Cr 208
- Tract 1 Cr 208
- 4345 Ellison St
- 4341 Ellison St
- 4337 Ellison St
- 4333 Ellison St
- 4313 Ellison St
- 4309 Ellison St
- 1816 Leissner St
- 3751 Crawford St
- 3747 Crawford St
- 3743 Crawford St
- 3739 Crawford St
- 1710 Longhorn Ave
- DAVIS Plan at Russell Ranch
- 457 Sargent Dr
- 4401 Sargent Dr
- 4302 7th St
- 00 Farm To Market Road 457
- 4308 7th St
- 4310 7th St
- 4208 7th St
- 177 Fm 457 Unit 179
- 34 Fm 457
- 4208 Sargent Dr
- 4301 7th St
- 4208 Farm To Market Road 457
- 4207 7th St
- 000 Fm 457 Sargent Hwy
- 4206 7th St
- 4200 Sargent Ct
- 1921 Old Van Vleck Rd
- 107 Fm 457
- 1917 Old Van Vleck Rd
- 109 Farm To Market Road 457