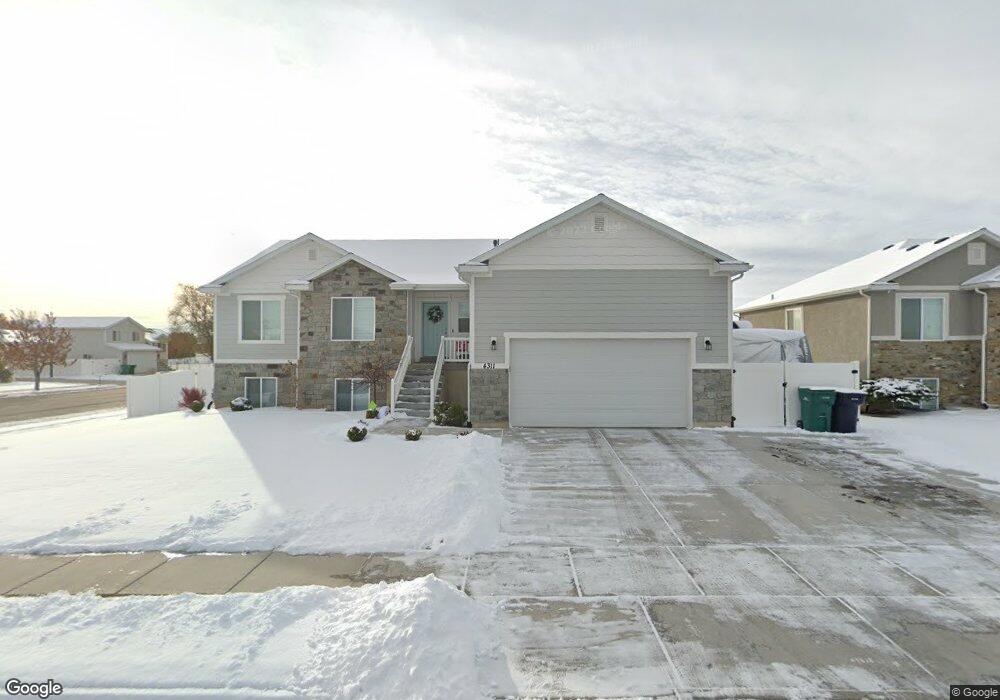
4311 W 5300 S Unit 43 Hooper, UT 84315
Estimated Value: $644,000 - $674,000
3
Beds
3
Baths
3,606
Sq Ft
$183/Sq Ft
Est. Value
About This Home
This home is located at 4311 W 5300 S Unit 43, Hooper, UT 84315 and is currently estimated at $660,259, approximately $183 per square foot. 4311 W 5300 S Unit 43 is a home located in Weber County with nearby schools including Freedom School, Roy Junior High School, and Roy High School.
Ownership History
Date
Name
Owned For
Owner Type
Purchase Details
Closed on
Apr 21, 2023
Sold by
Moore Korey K
Bought by
Warner Lindsey
Current Estimated Value
Home Financials for this Owner
Home Financials are based on the most recent Mortgage that was taken out on this home.
Original Mortgage
$255,000
Outstanding Balance
$248,479
Interest Rate
7.25%
Mortgage Type
New Conventional
Estimated Equity
$411,780
Purchase Details
Closed on
Aug 14, 2017
Sold by
Moore Korey K
Bought by
Moore Korey K
Home Financials for this Owner
Home Financials are based on the most recent Mortgage that was taken out on this home.
Original Mortgage
$130,000
Interest Rate
4.03%
Mortgage Type
Credit Line Revolving
Purchase Details
Closed on
Jul 2, 2014
Sold by
Hamblin Investments Inc
Bought by
Sierra Homes Constuction Inc
Create a Home Valuation Report for This Property
The Home Valuation Report is an in-depth analysis detailing your home's value as well as a comparison with similar homes in the area
Home Values in the Area
Average Home Value in this Area
Purchase History
| Date | Buyer | Sale Price | Title Company |
|---|---|---|---|
| Warner Lindsey | -- | Stewart Title | |
| Moore Korey K | -- | Hickman Land Title Co | |
| Moore Korey K | -- | American Secure Title Tremon | |
| Sierra Homes Constuction Inc | -- | Mountain View Title |
Source: Public Records
Mortgage History
| Date | Status | Borrower | Loan Amount |
|---|---|---|---|
| Open | Warner Lindsey | $255,000 | |
| Previous Owner | Moore Korey K | $130,000 |
Source: Public Records
Tax History Compared to Growth
Tax History
| Year | Tax Paid | Tax Assessment Tax Assessment Total Assessment is a certain percentage of the fair market value that is determined by local assessors to be the total taxable value of land and additions on the property. | Land | Improvement |
|---|---|---|---|---|
| 2025 | $2,379 | $643,694 | $200,052 | $443,642 |
| 2024 | $2,497 | $366,849 | $110,282 | $256,567 |
| 2023 | $2,422 | $349,250 | $109,822 | $239,428 |
| 2022 | $3,661 | $362,450 | $84,983 | $277,467 |
| 2021 | $2,709 | $452,000 | $109,173 | $342,827 |
| 2020 | $2,492 | $381,000 | $104,147 | $276,853 |
| 2019 | $2,504 | $362,000 | $102,745 | $259,255 |
| 2018 | $2,575 | $356,000 | $67,574 | $288,426 |
| 2017 | $910 | $67,005 | $67,005 | $0 |
| 2016 | $920 | $66,460 | $66,460 | $0 |
| 2015 | $862 | $61,373 | $61,373 | $0 |
| 2014 | $744 | $51,567 | $51,567 | $0 |
Source: Public Records
Map
Nearby Homes
- 4337 W 5430 S Unit A
- 4342 W 5430 S Unit B
- 4309 W 5430 St #B S
- 4449 W 5325 S
- 5270 S 4200 W
- 5116 S 4300 W
- 5539 S 4175 W
- 5465 S 4050 W
- 4218 W 5050 S
- 5013 S 4150 W
- 5235 Midland Dr
- 5644 S 4075 W
- 4990 S 4075 W
- 4021 W 5000 S
- 4700 W 5500 S
- 4556 W 4950 S
- 4141 W 4875 S
- 4890 S 4075 W
- 4106 W 4875 S
- 4632 W 5750 S
- 4325 W 5300 S Unit 50
- 4325 W 5300 S Unit 44
- 4325 W 5300 S
- 5323 S 4300 W
- 5348 S 4300 W
- 4339 W 5300 S
- 4339 W 5300 S Unit 45
- 5344 S 4300 W
- 5360 S 4300 W
- 4338 W 5350 S
- 5337 S 4300 W
- 5340 S 4300 W
- 4353 W 5300 S
- 4352 W 5350 S
- 4352 W 5350 S Unit 7
- 5332 S 4300 W
- 4335 W 5350 S
- 5345 S 4250 W
- 5399 S 4250 W
- 5381 S 4250 W