
Seller's Agent in 2025
Kathy Colville
Century 21 Redwood Realty
(703) 475-3484
10 in this area
254 Total Sales
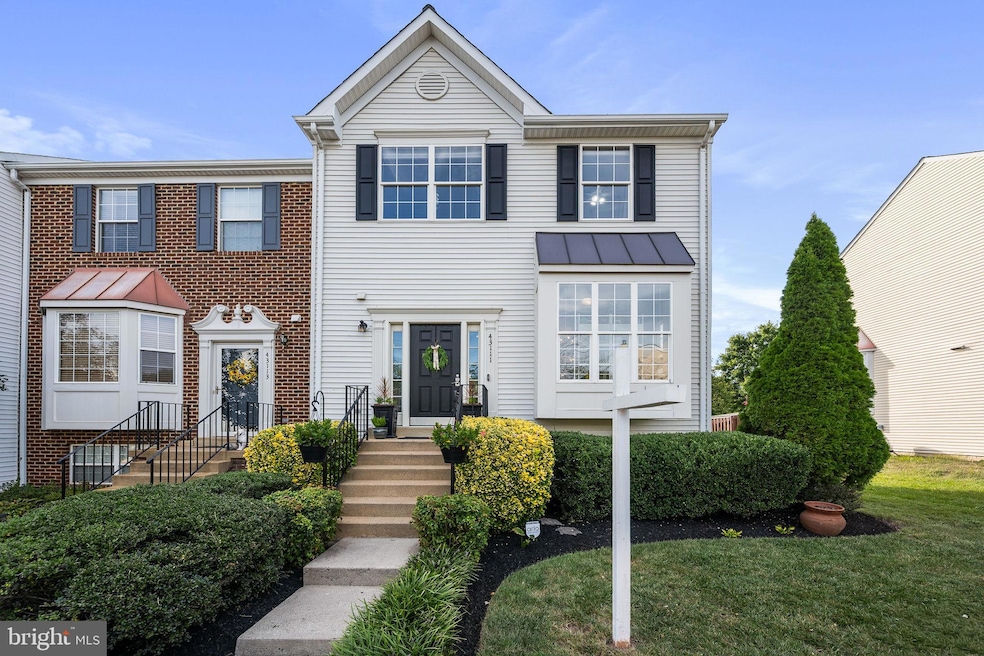
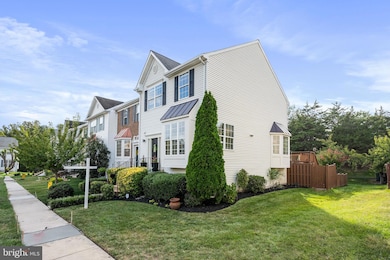
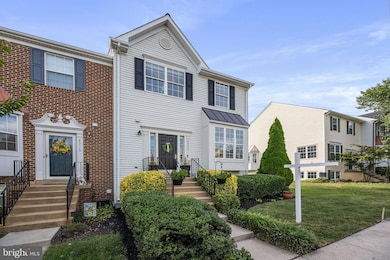
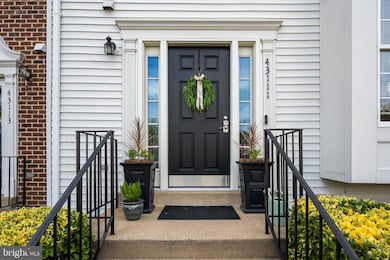
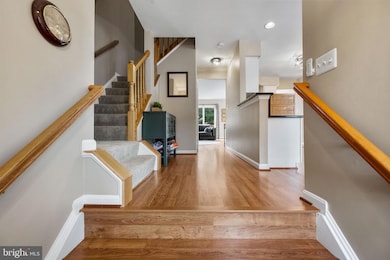
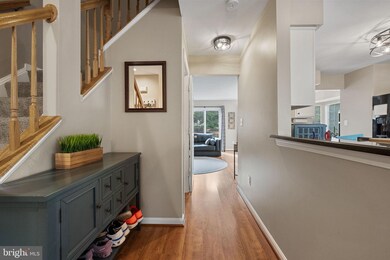
Stunning 3-Level End Unit Townhome in Sought-After Ashburn Farm! Welcome to this beautifully maintained 3-bedroom, 3.5-bathroom end-unit townhome offering the perfect blend of comfort, space, and convenience. Nestled in the heart of Ashburn Farm, this home features three finished levels, including a fully finished walk-out basement with a spacious rec room and full bath — ideal for guests, a home office, or entertainment space. The main level boasts beautiful laminate wood floors vand a bright, open layout. The kitchen is a chef’s dream with granite countertops, an abundance of cabinet and counter space, and a charming breakfast area perfect for casual dining. Step outside to the private deck — a great spot for morning coffee, grilling, or simply enjoying the outdoors. Upstairs, you'll find three generously sized bedrooms, including a serene primary suite with a luxurious soaking tub — your personal retreat after a long day. All major systems updated: Roof: 2020
Heat pump and gas furnace: Approx 2021
Water heater: new
Deck recently replaced Enjoy the privacy and extra natural light of this end-unit, plus easy access to major commuter routes, shopping, dining, parks, and just minutes to Dulles Airport. This is Northern Virginia living at its best — don’t miss it!
Last Agent to Sell the Property
(703) 475-3484 yes2kathy@gmail.com Century 21 Redwood Realty License #0024774 Listed on: 09/24/2025
| Date | Type | Sale Price | Title Company |
|---|---|---|---|
| Deed | $615,000 | Old Republic National Title In | |
| Interfamily Deed Transfer | -- | None Available | |
| Deed | $247,500 | -- | |
| Deed | $190,000 | -- | |
| Deed | $154,740 | -- |
| Date | Status | Loan Amount | Loan Type |
|---|---|---|---|
| Open | $30,750 | New Conventional | |
| Open | $603,860 | FHA | |
| Previous Owner | $235,950 | VA | |
| Previous Owner | $152,000 | No Value Available | |
| Previous Owner | $157,834 | No Value Available |
| Date | Event | Price | List to Sale | Price per Sq Ft |
|---|---|---|---|---|
| 10/31/2025 10/31/25 | Sold | $615,000 | 0.0% | $312 / Sq Ft |
| 09/24/2025 09/24/25 | For Sale | $615,000 | -- | $312 / Sq Ft |
| Year | Tax Paid | Tax Assessment Tax Assessment Total Assessment is a certain percentage of the fair market value that is determined by local assessors to be the total taxable value of land and additions on the property. | Land | Improvement |
|---|---|---|---|---|
| 2025 | $4,674 | $580,580 | $198,500 | $382,080 |
| 2024 | $4,627 | $534,910 | $188,500 | $346,410 |
| 2023 | $4,532 | $517,980 | $188,500 | $329,480 |
| 2022 | $4,179 | $469,520 | $168,500 | $301,020 |
| 2021 | $4,242 | $432,870 | $158,500 | $274,370 |
| 2020 | $4,174 | $403,250 | $128,500 | $274,750 |
| 2019 | $3,935 | $376,550 | $128,500 | $248,050 |
| 2018 | $3,940 | $363,140 | $128,500 | $234,640 |
| 2017 | $3,928 | $349,150 | $128,500 | $220,650 |
| 2016 | $3,919 | $342,270 | $0 | $0 |
| 2015 | $3,867 | $212,190 | $0 | $212,190 |
| 2014 | $3,832 | $203,270 | $0 | $203,270 |
Seller's Agent in 2025
Kathy Colville
Century 21 Redwood Realty
(703) 475-3484
10 in this area
254 Total Sales
Buyer's Agent in 2025
Angela Tanner
Samson Properties
(571) 599-6264
22 in this area
99 Total Sales
Source: Bright MLS
MLS Number: VALO2107148
APN: 117-45-9965
Disclaimer: Certain information contained herein is derived from information provided by parties other than Homes.com. All information provided is deemed reliable, but is not guaranteed to be accurate and should be independently verified.
![]() The data relating to real estate for sale on this website appears in part through the BRIGHT Internet Data Exchange program, a voluntary cooperative exchange of property listing data between licensed real estate brokerage firms, and is provided by BRIGHT through a licensing agreement.
The data relating to real estate for sale on this website appears in part through the BRIGHT Internet Data Exchange program, a voluntary cooperative exchange of property listing data between licensed real estate brokerage firms, and is provided by BRIGHT through a licensing agreement.
Listing information is from various brokers who participate in the Bright MLS IDX program and not all listings may be visible on the site.
The property information being provided on or through the website is for the personal, non-commercial use of consumers and such information may not be used for any purpose other than to identify prospective properties consumers may be interested in purchasing.
Some properties which appear for sale on the website may no longer be available because they are for instance, under contract, sold or are no longer being offered for sale.
Property information displayed is deemed reliable but is not guaranteed.
Copyright 2025 Bright MLS, Inc.