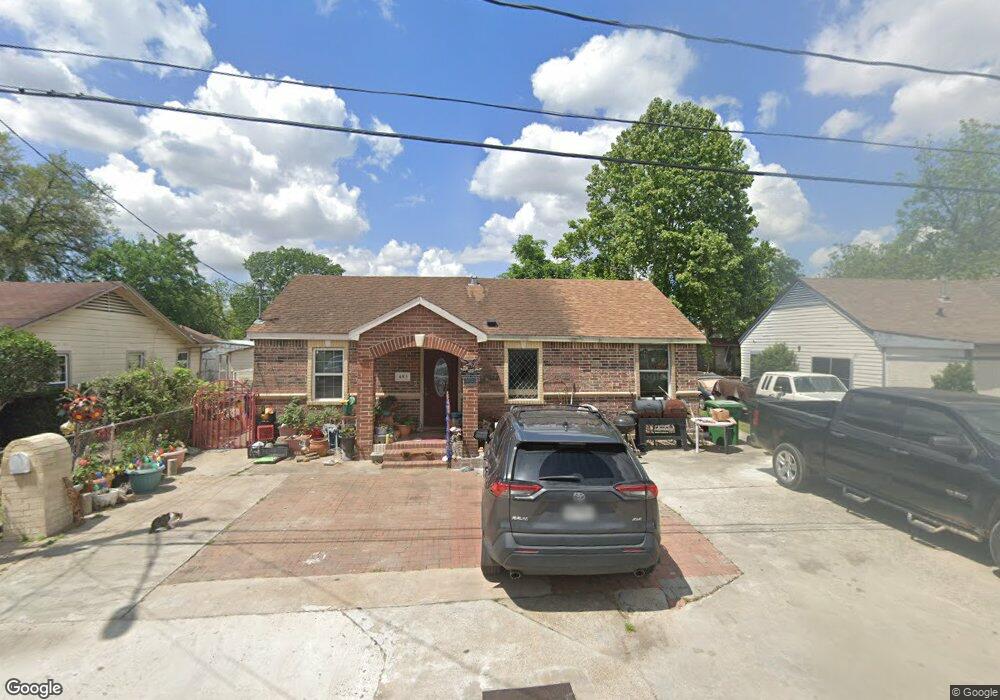
4313 Delhi St Houston, TX 77022
Independence Heights NeighborhoodEstimated Value: $218,000 - $257,752
4
Beds
2
Baths
2,083
Sq Ft
$117/Sq Ft
Est. Value
About This Home
This home is located at 4313 Delhi St, Houston, TX 77022 and is currently estimated at $243,438, approximately $116 per square foot. 4313 Delhi St is a home located in Harris County with nearby schools including Kennedy Elementary School, Williams Middle, and Booker T Washington Sr High.
Ownership History
Date
Name
Owned For
Owner Type
Purchase Details
Closed on
Sep 11, 2018
Sold by
Q I A P M Inc
Bought by
Tavira Manuel and Tavira Gloria
Current Estimated Value
Home Financials for this Owner
Home Financials are based on the most recent Mortgage that was taken out on this home.
Original Mortgage
$350,000
Outstanding Balance
$305,249
Interest Rate
4.6%
Mortgage Type
Purchase Money Mortgage
Estimated Equity
-$61,811
Create a Home Valuation Report for This Property
The Home Valuation Report is an in-depth analysis detailing your home's value as well as a comparison with similar homes in the area
Home Values in the Area
Average Home Value in this Area
Purchase History
| Date | Buyer | Sale Price | Title Company |
|---|---|---|---|
| Tavira Manuel | -- | North Star Title Company |
Source: Public Records
Mortgage History
| Date | Status | Borrower | Loan Amount |
|---|---|---|---|
| Open | Tavira Manuel | $350,000 |
Source: Public Records
Tax History Compared to Growth
Tax History
| Year | Tax Paid | Tax Assessment Tax Assessment Total Assessment is a certain percentage of the fair market value that is determined by local assessors to be the total taxable value of land and additions on the property. | Land | Improvement |
|---|---|---|---|---|
| 2025 | $1,939 | $212,605 | $135,000 | $77,605 |
| 2024 | $1,939 | $215,332 | $135,000 | $80,332 |
| 2023 | $1,939 | $184,554 | $120,000 | $64,554 |
| 2022 | $3,047 | $177,881 | $120,000 | $57,881 |
| 2021 | $2,932 | $147,238 | $95,000 | $52,238 |
| 2020 | $2,769 | $125,391 | $90,000 | $35,391 |
| 2019 | $2,631 | $111,008 | $45,000 | $66,008 |
| 2018 | $1,621 | $109,580 | $45,000 | $64,580 |
| 2017 | $2,173 | $96,082 | $30,000 | $66,082 |
| 2016 | $1,975 | $78,110 | $20,000 | $58,110 |
| 2015 | $1,451 | $78,110 | $20,000 | $58,110 |
| 2014 | $1,451 | $78,894 | $13,750 | $65,144 |
Source: Public Records
Map
Nearby Homes
- 4309 Delhi St
- 4305 Castor St
- 4311 Europa St
- 4303 Castor Na St
- 4302 Delhi St
- 4303 Castor St
- 4220 Delhi St
- 821 Barkley St
- 4440 Castor St
- 4208 Castor St Unit B
- 4208 Castor St Unit A
- 4311 Busiek St
- 821 Neyland St
- 4208 Europa St
- 1204 Johnston St
- 1216 Johnston St Unit A/B
- 4303 Cadmus St
- 1222 Johnston St
- 1228 Johnston St
- 1224 Johnston St