4313 Marietta Ave Columbia, PA 17512
Estimated Value: $196,000 - $266,000
3
Beds
2
Baths
1,102
Sq Ft
$220/Sq Ft
Est. Value
About This Home
This home is located at 4313 Marietta Ave, Columbia, PA 17512 and is currently estimated at $242,519, approximately $220 per square foot. 4313 Marietta Ave is a home located in Lancaster County with nearby schools including Farmdale Elementary School, Landisville Middle School, and Hempfield High School.
Ownership History
Date
Name
Owned For
Owner Type
Purchase Details
Closed on
Jun 5, 2019
Sold by
Mathew Manesh A
Bought by
Snyder Tonya R
Current Estimated Value
Purchase Details
Closed on
Jan 12, 2017
Sold by
Guldner Timothy J and Guldner Caryn E
Bought by
Mathew Manesh A
Purchase Details
Closed on
Sep 2, 2009
Sold by
Leventry Daniel B and Leventry Ruth A
Bought by
Guldner Timothy J and Guldner Caryn E
Home Financials for this Owner
Home Financials are based on the most recent Mortgage that was taken out on this home.
Original Mortgage
$168,367
Interest Rate
5.36%
Mortgage Type
New Conventional
Purchase Details
Closed on
May 12, 2006
Sold by
Federal National Mortgage Association
Bought by
Leventry Daniel B and Leventry Ruth A
Purchase Details
Closed on
Feb 22, 2006
Sold by
Carnathan Lisa and Carnathan Robert
Bought by
Fannie Mae
Create a Home Valuation Report for This Property
The Home Valuation Report is an in-depth analysis detailing your home's value as well as a comparison with similar homes in the area
Home Values in the Area
Average Home Value in this Area
Purchase History
| Date | Buyer | Sale Price | Title Company |
|---|---|---|---|
| Snyder Tonya R | $80,000 | None Available | |
| Mathew Manesh A | $158,500 | None Available | |
| Guldner Timothy J | $165,000 | None Available | |
| Leventry Daniel B | $93,500 | None Available | |
| Fannie Mae | $2,944 | None Available |
Source: Public Records
Mortgage History
| Date | Status | Borrower | Loan Amount |
|---|---|---|---|
| Previous Owner | Guldner Timothy J | $168,367 |
Source: Public Records
Tax History Compared to Growth
Tax History
| Year | Tax Paid | Tax Assessment Tax Assessment Total Assessment is a certain percentage of the fair market value that is determined by local assessors to be the total taxable value of land and additions on the property. | Land | Improvement |
|---|---|---|---|---|
| 2025 | $3,044 | $135,000 | $58,600 | $76,400 |
| 2024 | $3,044 | $135,000 | $58,600 | $76,400 |
| 2023 | $2,986 | $135,000 | $58,600 | $76,400 |
| 2022 | $2,907 | $135,000 | $58,600 | $76,400 |
| 2021 | $2,850 | $135,000 | $58,600 | $76,400 |
| 2020 | $2,850 | $135,000 | $58,600 | $76,400 |
| 2019 | $2,803 | $135,000 | $58,600 | $76,400 |
| 2018 | $3,333 | $135,000 | $58,600 | $76,400 |
| 2017 | $3,049 | $118,600 | $45,900 | $72,700 |
| 2016 | $2,989 | $118,600 | $45,900 | $72,700 |
| 2015 | $602 | $118,600 | $45,900 | $72,700 |
| 2014 | $2,184 | $118,600 | $45,900 | $72,700 |
Source: Public Records
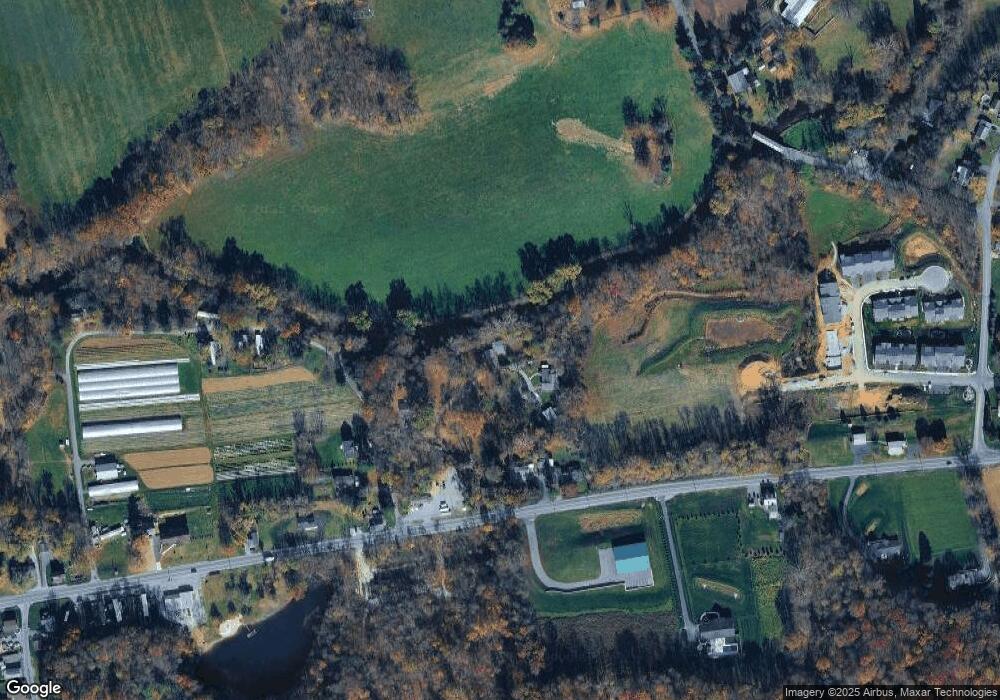
Map
Nearby Homes
- 4309 Marietta Ave
- 4330 Heather Ln Unit 8
- 4328 Heather Ln Unit 7
- 4326 Heather Ln Unit 6
- 4324 Heather Ln Unit 5
- 4331 Heather Ln Unit 44
- 4333 Heather Ln Unit 43
- 4337 Heather Ln Unit 41
- 4335 Heather Ln Unit 42
- 4318 Heather Ln Unit 2
- 4493 LOT #1 Chinchilla Ave
- 4493 LOT #2 Chinchilla Ave
- 4032 Bradford Cir
- 4003 Parkside Ct
- 520 Betty Ln
- 4063 Laurel Ln
- 4068 Laurel Ln
- 2640 Hemlock Dr
- 121 Erica Ln
- 122 Erica Ln
- 4311 Marietta Ave
- 4317 Marietta Ave
- 4307 Marietta Ave
- 4305 Marietta Ave
- 4321 Marietta Ave
- 4319 Marietta Ave
- 4357 Marietta Ave
- 4320 Marietta Ave
- 4350 Marietta Ave
- 4363 Marietta Ave
- 4324 Marietta Pike
- 4318 Marietta Ave
- 4347 Marietta Ave
- 4345 Marietta Ave
- 816 Talon Way
- 823 Talon Way
- 821 Talon Way Unit 62
- 4365 Marietta Ave
- 4319 Heather Ln
- 4308 Marietta Ave