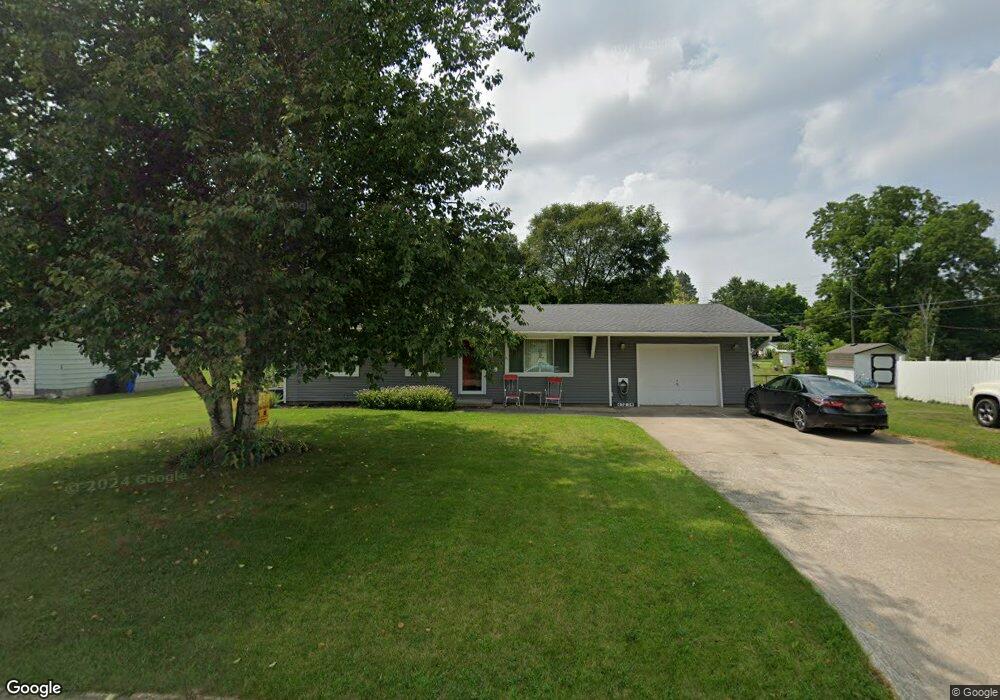
4313 Sherman St Cass City, MI 48726
Estimated Value: $110,000 - $139,000
3
Beds
1
Bath
1,000
Sq Ft
$126/Sq Ft
Est. Value
About This Home
This home is located at 4313 Sherman St, Cass City, MI 48726 and is currently estimated at $125,805, approximately $125 per square foot. 4313 Sherman St is a home located in Tuscola County with nearby schools including Cass City Elementary School and Cass City Junior/Senior High School.
Ownership History
Date
Name
Owned For
Owner Type
Purchase Details
Closed on
Sep 29, 2009
Sold by
Deutsche Bank National Trust Co
Bought by
Krueger Rhonda L
Current Estimated Value
Home Financials for this Owner
Home Financials are based on the most recent Mortgage that was taken out on this home.
Original Mortgage
$32,800
Interest Rate
5.37%
Mortgage Type
Adjustable Rate Mortgage/ARM
Purchase Details
Closed on
Feb 12, 2009
Sold by
Hewitt Carol
Bought by
Deutsche Bank National Trust Co and Morgan Stanley Abs Capital I Inc
Purchase Details
Closed on
Aug 8, 2006
Sold by
Weidman Pauline A
Bought by
Hewitt Carol
Home Financials for this Owner
Home Financials are based on the most recent Mortgage that was taken out on this home.
Original Mortgage
$64,329
Interest Rate
8.99%
Mortgage Type
Adjustable Rate Mortgage/ARM
Purchase Details
Closed on
Nov 30, 2004
Sold by
Brown Murray Dale and Brown Pauline Audrey
Bought by
Brown M Dale and Brown Pauline A
Create a Home Valuation Report for This Property
The Home Valuation Report is an in-depth analysis detailing your home's value as well as a comparison with similar homes in the area
Home Values in the Area
Average Home Value in this Area
Purchase History
| Date | Buyer | Sale Price | Title Company |
|---|---|---|---|
| Krueger Rhonda L | $41,000 | E-Title | |
| Deutsche Bank National Trust Co | $40,500 | None Available | |
| Hewitt Carol | $80,412 | None Available | |
| Brown M Dale | -- | None Available |
Source: Public Records
Mortgage History
| Date | Status | Borrower | Loan Amount |
|---|---|---|---|
| Previous Owner | Krueger Rhonda L | $32,800 | |
| Previous Owner | Hewitt Carol | $64,329 |
Source: Public Records
Tax History Compared to Growth
Tax History
| Year | Tax Paid | Tax Assessment Tax Assessment Total Assessment is a certain percentage of the fair market value that is determined by local assessors to be the total taxable value of land and additions on the property. | Land | Improvement |
|---|---|---|---|---|
| 2025 | $1,268 | $51,800 | $0 | $0 |
| 2024 | $1,268 | $48,100 | $0 | $0 |
| 2023 | $717 | $38,800 | $0 | $0 |
| 2022 | $1,151 | $33,900 | $0 | $0 |
| 2021 | $1,116 | $32,700 | $0 | $0 |
| 2020 | $1,102 | $31,000 | $0 | $0 |
| 2019 | $640 | $24,100 | $0 | $0 |
| 2018 | $1,177 | $28,000 | $0 | $0 |
| 2017 | $1,271 | $28,400 | $0 | $0 |
| 2016 | $1,103 | $27,900 | $0 | $0 |
| 2015 | $6 | $25,400 | $0 | $0 |
| 2014 | $6 | $26,000 | $0 | $0 |
| 2013 | $6 | $26,000 | $0 | $0 |
Source: Public Records
Map
Nearby Homes
- 4286 Oak St
- 4567 Seeger St
- 6276 Pine St
- 4659 Seeger St
- 4633 Huron St
- Vacant land Doerr Rd
- 0 Chippewa Trail Unit 20240025599
- 0 Seeger St
- 3803 Warner Rd
- 2665 N Cemetery Rd
- V/L Warner Rd
- 5730 Van Dyke Rd
- 4792 State St
- 4307 Hobart Rd
- 5831 Reed St
- 0 Deckerville Deckerville Rd
- 3151 Mcgregory Rd
- 0000 Cooklin Rd
- 5357 Owendale Rd
- 2750 E Deckerville Rd