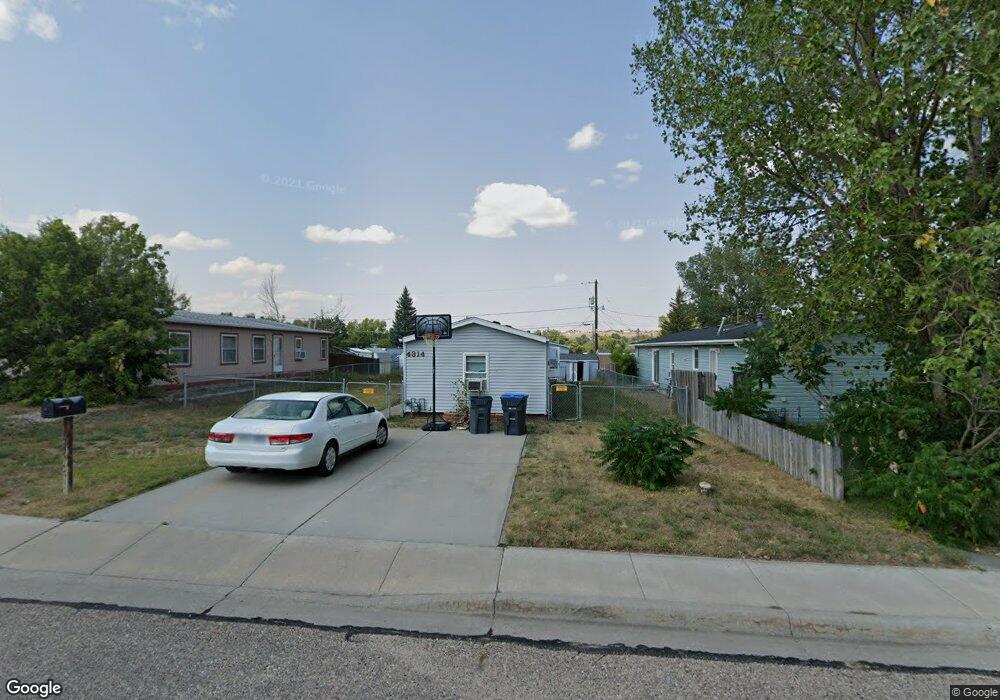
4314 Bevans St Cheyenne, WY 82001
Estimated Value: $249,052 - $350,000
--
Bed
--
Bath
1,216
Sq Ft
$240/Sq Ft
Est. Value
About This Home
This home is located at 4314 Bevans St, Cheyenne, WY 82001 and is currently estimated at $291,513, approximately $239 per square foot. 4314 Bevans St is a home located in Laramie County with nearby schools including Baggs Elementary School, Carey Junior High School, and East High School.
Ownership History
Date
Name
Owned For
Owner Type
Purchase Details
Closed on
Dec 4, 2018
Sold by
Hemenover Robert D
Bought by
Portz Alice A
Current Estimated Value
Purchase Details
Closed on
Dec 22, 2003
Sold by
Hemenover Robert D and Barnes Jennifer L
Bought by
Hemenover Robert D
Home Financials for this Owner
Home Financials are based on the most recent Mortgage that was taken out on this home.
Original Mortgage
$83,169
Interest Rate
5.81%
Mortgage Type
FHA
Purchase Details
Closed on
Nov 13, 2003
Sold by
Chiporo Salvatore R and Chiporo Courtney B
Bought by
Hemenover Robert and Barnes Jennifer
Home Financials for this Owner
Home Financials are based on the most recent Mortgage that was taken out on this home.
Original Mortgage
$83,169
Interest Rate
5.81%
Mortgage Type
FHA
Create a Home Valuation Report for This Property
The Home Valuation Report is an in-depth analysis detailing your home's value as well as a comparison with similar homes in the area
Home Values in the Area
Average Home Value in this Area
Purchase History
| Date | Buyer | Sale Price | Title Company |
|---|---|---|---|
| Portz Alice A | -- | None Available | |
| Hemenover Robert D | -- | -- | |
| Hemenover Robert | -- | -- |
Source: Public Records
Mortgage History
| Date | Status | Borrower | Loan Amount |
|---|---|---|---|
| Previous Owner | Hemenover Robert | $83,169 |
Source: Public Records
Tax History Compared to Growth
Tax History
| Year | Tax Paid | Tax Assessment Tax Assessment Total Assessment is a certain percentage of the fair market value that is determined by local assessors to be the total taxable value of land and additions on the property. | Land | Improvement |
|---|---|---|---|---|
| 2025 | $1,097 | $12,005 | $2,507 | $9,498 |
| 2024 | $1,097 | $15,515 | $3,343 | $12,172 |
| 2023 | $1,064 | $15,047 | $3,343 | $11,704 |
| 2022 | $946 | $13,102 | $3,343 | $9,759 |
| 2021 | $851 | $11,767 | $3,036 | $8,731 |
| 2020 | $782 | $10,834 | $3,036 | $7,798 |
| 2019 | $763 | $10,572 | $3,036 | $7,536 |
| 2018 | $717 | $10,027 | $3,036 | $6,991 |
| 2017 | $727 | $10,067 | $3,036 | $7,031 |
| 2016 | $718 | $9,951 | $2,896 | $7,055 |
| 2015 | $705 | $9,762 | $2,896 | $6,866 |
| 2014 | $711 | $9,778 | $2,896 | $6,882 |
Source: Public Records
Map
Nearby Homes
- 4315 Bevans St
- 4547 Rock Springs St
- 4112 Gem Trail
- 4002 Cheyenne St
- 3711 Rawlins St
- Lot 1 Block 2 N College Dr
- Lot 1 Block 1 N College Dr
- 3802 Mccann Ave
- 4013 Bradney Ave
- 5014 Crews Ct
- 5001 Sunny Ridge Ln
- 3820 E Pershing Blvd
- 3820 E Pershing Blvd
- 4904 E Pershing Blvd
- 4518 Ontario Ave
- TBD Rock Springs St
- TBD Atkin St
- 4519 Marble Ave
- 4206 Woodcrest Ave
- 3316 Rock Springs St
- 4308 Bevans St
- 4320 Bevans St
- 4302 Bevans St
- 3704 Cleveland Ave
- 4315 Rawlins St
- 4309 Rawlins St
- 4325 Rawlins St
- 4303 Rawlins St
- 4216 Bevans St
- 4305 Bevans St
- 4215 Rawlins St
- 3618 Cleveland Ave
- 4221 Bevans St
- 3707 Cleveland Ave
- 3713 Cleveland Ave
- 4211 Rawlins St
- 3701 Cleveland Ave
- 4215 Bevans St
- 3627 Cleveland Ave
- 3725 Cleveland Ave