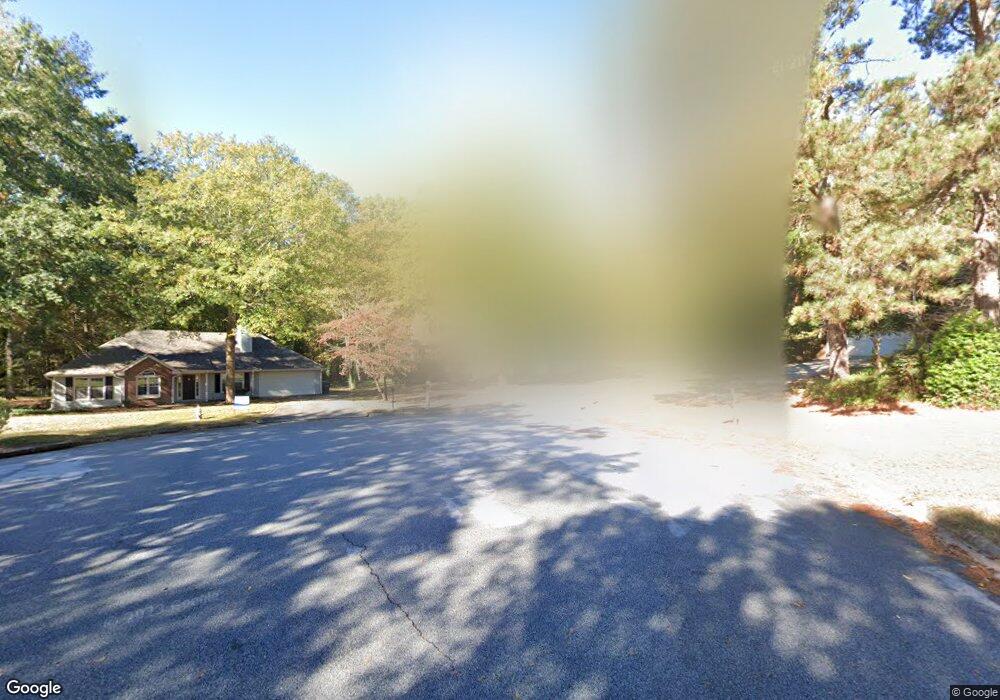
4314 Derbyshire Trace SE Unit 19 Conyers, GA 30094
Estimated Value: $253,265 - $292,000
3
Beds
2
Baths
1,662
Sq Ft
$160/Sq Ft
Est. Value
About This Home
This home is located at 4314 Derbyshire Trace SE Unit 19, Conyers, GA 30094 and is currently estimated at $266,316, approximately $160 per square foot. 4314 Derbyshire Trace SE Unit 19 is a home located in Rockdale County with nearby schools including Barksdale Elementary School, Gen. Ray Davis Middle School, and Salem High School.
Ownership History
Date
Name
Owned For
Owner Type
Purchase Details
Closed on
May 28, 2020
Sold by
Mupr 3 Assets Llc
Bought by
Amnl Asset Co 1 Llc
Current Estimated Value
Purchase Details
Closed on
Oct 10, 2019
Sold by
Hart Terry Lee
Bought by
Mupr 3 Assets Llc
Purchase Details
Closed on
Mar 16, 2015
Sold by
Adams Norma
Bought by
Hart Terry Lee
Home Financials for this Owner
Home Financials are based on the most recent Mortgage that was taken out on this home.
Original Mortgage
$95,200
Interest Rate
3.79%
Mortgage Type
New Conventional
Purchase Details
Closed on
Jun 15, 2012
Sold by
Equity Trust Co
Bought by
Adams Norma
Purchase Details
Closed on
Nov 1, 2011
Sold by
Alliston Leland
Bought by
Equity Trust Co Custodian Fbo
Purchase Details
Closed on
Oct 30, 2011
Sold by
Alliston Leland E
Bought by
Alliston Leslie Ann Dykes
Create a Home Valuation Report for This Property
The Home Valuation Report is an in-depth analysis detailing your home's value as well as a comparison with similar homes in the area
Home Values in the Area
Average Home Value in this Area
Purchase History
| Date | Buyer | Sale Price | Title Company |
|---|---|---|---|
| Amnl Asset Co 1 Llc | $165,383 | -- | |
| Mupr 3 Assets Llc | $152,000 | -- | |
| Hart Terry Lee | $119,000 | -- | |
| Adams Norma | $50,000 | -- | |
| Equity Trust Co Custodian Fbo | $31,500 | -- | |
| Alliston Leslie Ann Dykes | -- | -- |
Source: Public Records
Mortgage History
| Date | Status | Borrower | Loan Amount |
|---|---|---|---|
| Previous Owner | Hart Terry Lee | $95,200 |
Source: Public Records
Tax History Compared to Growth
Tax History
| Year | Tax Paid | Tax Assessment Tax Assessment Total Assessment is a certain percentage of the fair market value that is determined by local assessors to be the total taxable value of land and additions on the property. | Land | Improvement |
|---|---|---|---|---|
| 2024 | $4,167 | $104,320 | $20,480 | $83,840 |
| 2023 | $3,995 | $97,360 | $20,480 | $76,880 |
| 2022 | $3,494 | $84,720 | $17,960 | $66,760 |
| 2021 | $2,726 | $66,153 | $10,772 | $55,381 |
| 2020 | $2,590 | $60,360 | $9,880 | $50,480 |
| 2019 | $2,526 | $55,880 | $8,400 | $47,480 |
| 2018 | $2,369 | $52,160 | $6,640 | $45,520 |
| 2017 | $2,184 | $47,600 | $7,240 | $40,360 |
| 2016 | $2,051 | $44,680 | $6,000 | $38,680 |
| 2015 | $1,417 | $30,720 | $5,200 | $25,520 |
| 2014 | $1,432 | $30,720 | $5,200 | $25,520 |
| 2013 | -- | $38,800 | $10,000 | $28,800 |
Source: Public Records
Map
Nearby Homes
- 246 Bridgewood Dr SE
- 4530 Wentworth Place SW
- 1023 Plantation Ct SE
- 385 Oglesby Bridge Rd SE
- 1119 Plantation Dr SE
- 1590 Colonial South Dr SW
- 4970 Hull Rd SE
- 1938 Highway 212 SW
- 1433 Cotton Trail SW
- 4797 Hemlock Dr SE
- 1038 Plantation Blvd SE
- 495 Oglesby Bridge Rd SE
- 1459 Highway 212 SW
- 510 Bell Rd SE Unit 1
- 4275 Troupe Smith Rd SE
- 1861 Crowell Rd SW
- 550 Oglesby Bridge Rd SE
- 2104 Crest Wood Dr
- 4811 W Lake Dr SE
- 4314 Derbyshire Trace SE
- 4314 Derbyshire Trace SE
- 0 Derbyshire Trace SE Unit 7290667
- 0 Derbyshire Trace SE Unit 7275322
- 0 Derbyshire Trace SE Unit 7119834
- 0 Derbyshire Trace SE Unit 3162356
- 0 Derbyshire Trace SE Unit 7095928
- 0 Derbyshire Trace SE Unit 7146355
- 0 Derbyshire Trace SE
- 4312 Derbyshire Trace SE
- 4316 Derbyshire Trace SE
- 4310 Derbyshire Trace SE
- 507 Ironwood Ct SE
- 4325 Derbyshire Trace SE Unit IV
- 4323 Derbyshire Trace SE Unit 4
- 503 Ironwood Ct SE Unit 4
- 4308 Derbyshire Trace SE
- 4321 Derbyshire Trace SE
- 0 Lymehouse Ct SE
- 4752 Cold Creek Way SE