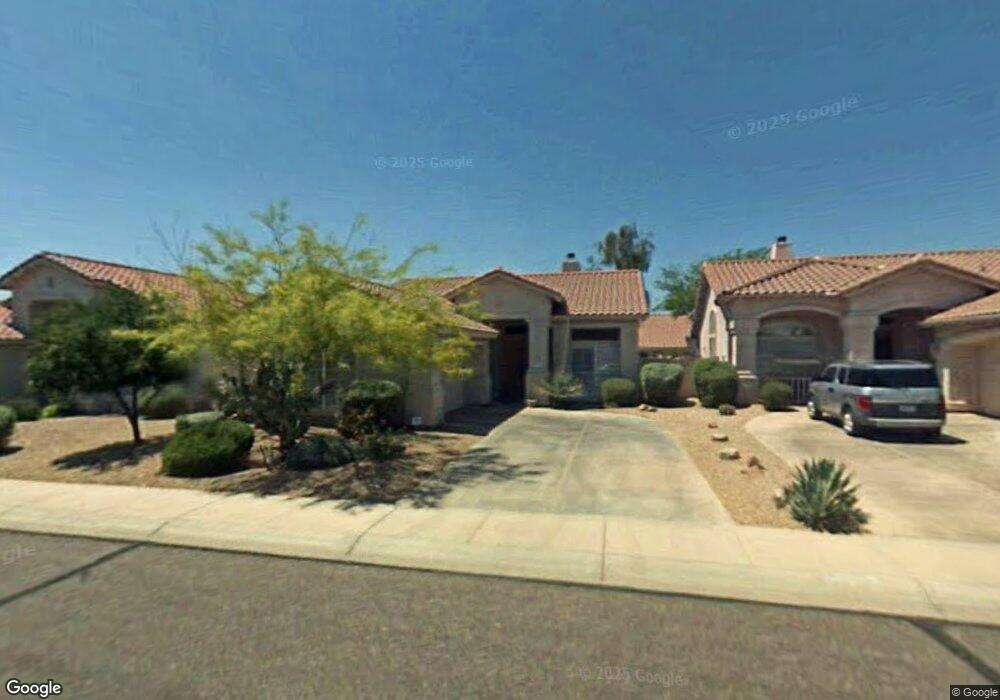
4314 E Rancho Caliente Dr Cave Creek, AZ 85331
Desert View NeighborhoodEstimated Value: $435,051 - $570,000
--
Bed
3
Baths
1,588
Sq Ft
$333/Sq Ft
Est. Value
About This Home
This home is located at 4314 E Rancho Caliente Dr, Cave Creek, AZ 85331 and is currently estimated at $529,013, approximately $333 per square foot. 4314 E Rancho Caliente Dr is a home located in Maricopa County with nearby schools including Desert Willow Elementary School, Cactus Shadows High School, and Sonoran Trails Middle School.
Ownership History
Date
Name
Owned For
Owner Type
Purchase Details
Closed on
Aug 16, 2005
Sold by
Karamooz Saiedeh
Bought by
Yuan Chen
Current Estimated Value
Home Financials for this Owner
Home Financials are based on the most recent Mortgage that was taken out on this home.
Original Mortgage
$287,200
Outstanding Balance
$150,385
Interest Rate
5.61%
Mortgage Type
Fannie Mae Freddie Mac
Estimated Equity
$378,628
Purchase Details
Closed on
Aug 9, 2005
Sold by
Yuan Hao Hao
Bought by
Yuan Chen
Home Financials for this Owner
Home Financials are based on the most recent Mortgage that was taken out on this home.
Original Mortgage
$287,200
Outstanding Balance
$150,385
Interest Rate
5.61%
Mortgage Type
Fannie Mae Freddie Mac
Estimated Equity
$378,628
Purchase Details
Closed on
Jul 21, 2000
Sold by
Karamooz Ali Akbar
Bought by
Karamooz Saiedeh
Create a Home Valuation Report for This Property
The Home Valuation Report is an in-depth analysis detailing your home's value as well as a comparison with similar homes in the area
Home Values in the Area
Average Home Value in this Area
Purchase History
| Date | Buyer | Sale Price | Title Company |
|---|---|---|---|
| Yuan Chen | $359,000 | Security Title Agency Inc | |
| Yuan Chen | -- | Security Title Agency Inc | |
| Karamooz Saiedeh | -- | Security Title Agency | |
| Karamooz Saiedeh | $160,000 | Security Title Agency |
Source: Public Records
Mortgage History
| Date | Status | Borrower | Loan Amount |
|---|---|---|---|
| Open | Yuan Chen | $287,200 | |
| Closed | Yuan Chen | $287,200 |
Source: Public Records
Tax History Compared to Growth
Tax History
| Year | Tax Paid | Tax Assessment Tax Assessment Total Assessment is a certain percentage of the fair market value that is determined by local assessors to be the total taxable value of land and additions on the property. | Land | Improvement |
|---|---|---|---|---|
| 2025 | $1,455 | $25,244 | -- | -- |
| 2024 | $1,394 | $24,042 | -- | -- |
| 2023 | $1,394 | $34,830 | $6,960 | $27,870 |
| 2022 | $1,356 | $26,800 | $5,360 | $21,440 |
| 2021 | $1,445 | $25,220 | $5,040 | $20,180 |
| 2020 | $1,411 | $22,710 | $4,540 | $18,170 |
| 2019 | $1,361 | $22,650 | $4,530 | $18,120 |
| 2018 | $1,308 | $21,360 | $4,270 | $17,090 |
| 2017 | $1,260 | $20,320 | $4,060 | $16,260 |
| 2016 | $1,239 | $19,780 | $3,950 | $15,830 |
| 2015 | $1,120 | $19,600 | $3,920 | $15,680 |
Source: Public Records
Map
Nearby Homes
- 4257 E Desert Marigold Dr
- 4243 E Desert Marigold Dr Unit 3
- 4235 E Desert Marigold Dr
- 30651 N 44th St
- 4449 E Rancho Caliente Dr
- 4443 E Chaparosa Way
- 31058 N 44th Way
- 31035 N 45th St
- 30844 N 41st Place
- 4226 E Creosote Dr
- 4302 E Milton Dr
- 4045 E Desert Marigold Dr
- 30430 N 42nd Place
- 31601 N 44th St
- 4102 E Rancho Tierra Dr
- 31524 N 42nd Place
- Spur Cross Plan at Forest Pleasant Estates
- Overton Plan at Forest Pleasant Estates
- Ocotillo Plan at Forest Pleasant Estates
- Sidewinder Plan at Forest Pleasant Estates
- 4318 E Rancho Caliente Dr
- 4310 E Rancho Caliente Dr
- 4322 E Rancho Caliente Dr
- 4303 E Wildcat Dr
- 4306 E Rancho Caliente Dr
- 4243 E Wildcat Dr
- 4311 E Wildcat Dr
- 4313 E Rancho Caliente Dr
- 4326 E Rancho Caliente Dr
- 4317 E Rancho Caliente Dr
- 4309 E Rancho Caliente Dr
- 4315 E Wildcat Dr Unit 12
- 4305 E Rancho Caliente Dr
- 4235 E Wildcat Dr
- 4330 E Rancho Caliente Dr
- 4325 E Rancho Caliente Dr Unit 2
- 4232 E Rancho Caliente Dr Unit 2
- 4319 E Wildcat Dr
- 4301 E Rancho Caliente Dr
- 4329 E Rancho Caliente Dr