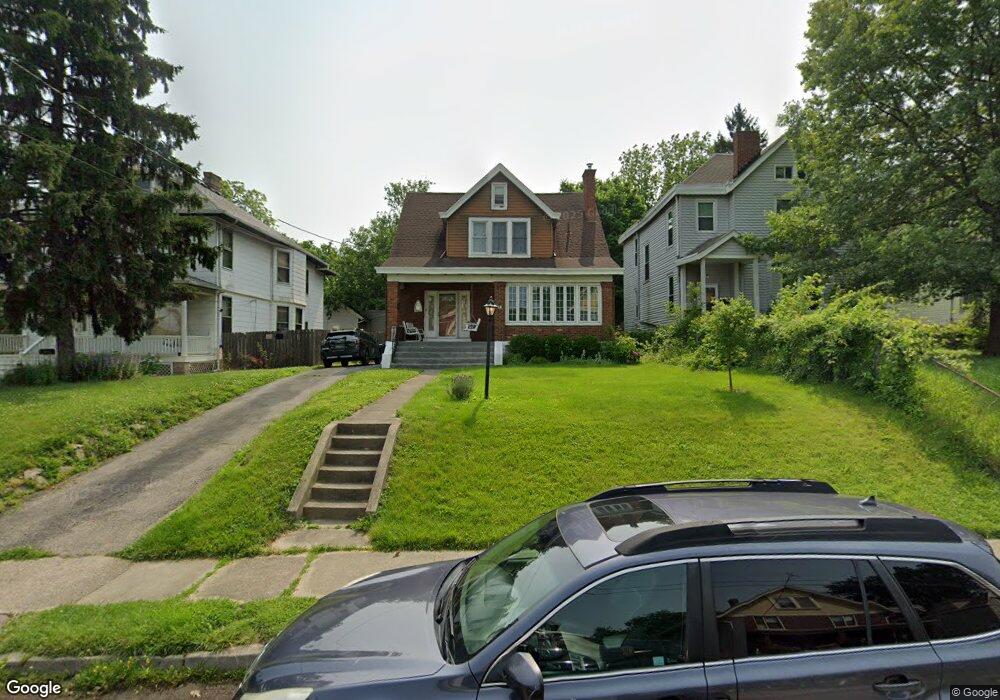
4314 Franklin Ave Cincinnati, OH 45212
Estimated Value: $163,000 - $254,059
3
Beds
2
Baths
1,737
Sq Ft
$127/Sq Ft
Est. Value
About This Home
This home is located at 4314 Franklin Ave, Cincinnati, OH 45212 and is currently estimated at $220,765, approximately $127 per square foot. 4314 Franklin Ave is a home located in Hamilton County with nearby schools including Norwood High School, Cornerstone Christian Academy, and Immaculate Conception Academy.
Ownership History
Date
Name
Owned For
Owner Type
Purchase Details
Closed on
Jan 12, 2024
Sold by
Doan Carrie
Bought by
Doan Ryan A
Current Estimated Value
Purchase Details
Closed on
Feb 26, 2015
Sold by
York Gregory
Bought by
Doan Ryan A and Doan Carrie
Home Financials for this Owner
Home Financials are based on the most recent Mortgage that was taken out on this home.
Original Mortgage
$68,000
Interest Rate
3.64%
Mortgage Type
Unknown
Purchase Details
Closed on
Jul 29, 2011
Sold by
Matre Kerrie K
Bought by
York Gregory
Purchase Details
Closed on
May 2, 2011
Sold by
Citifinancial Inc
Bought by
Matre Kerrie K
Purchase Details
Closed on
Nov 4, 2010
Sold by
Frazier Judith I
Bought by
Citifinancial Inc
Create a Home Valuation Report for This Property
The Home Valuation Report is an in-depth analysis detailing your home's value as well as a comparison with similar homes in the area
Home Values in the Area
Average Home Value in this Area
Purchase History
| Date | Buyer | Sale Price | Title Company |
|---|---|---|---|
| Doan Ryan A | -- | None Listed On Document | |
| Doan Ryan A | -- | None Listed On Document | |
| Doan Ryan A | $85,000 | Attorney | |
| York Gregory | $45,000 | Attorney | |
| Matre Kerrie K | $8,500 | Attorney | |
| Citifinancial Inc | $69,870 | Attorney |
Source: Public Records
Mortgage History
| Date | Status | Borrower | Loan Amount |
|---|---|---|---|
| Previous Owner | Doan Ryan A | $68,000 |
Source: Public Records
Tax History
| Year | Tax Paid | Tax Assessment Tax Assessment Total Assessment is a certain percentage of the fair market value that is determined by local assessors to be the total taxable value of land and additions on the property. | Land | Improvement |
|---|---|---|---|---|
| 2025 | $3,143 | $60,627 | $12,761 | $47,866 |
| 2024 | $3,234 | $60,627 | $12,761 | $47,866 |
| 2023 | $3,252 | $60,627 | $12,761 | $47,866 |
| 2022 | $2,162 | $33,916 | $8,572 | $25,344 |
| 2021 | $2,139 | $33,916 | $8,572 | $25,344 |
| 2020 | $2,092 | $33,916 | $8,572 | $25,344 |
| 2019 | $1,997 | $29,750 | $7,518 | $22,232 |
| 2018 | $1,998 | $29,750 | $7,518 | $22,232 |
| 2017 | $1,913 | $29,750 | $7,518 | $22,232 |
| 2016 | $1,000 | $14,806 | $7,067 | $7,739 |
| 2015 | $879 | $14,806 | $7,067 | $7,739 |
| 2014 | $880 | $14,806 | $7,067 | $7,739 |
| 2013 | $926 | $15,750 | $7,518 | $8,232 |
Source: Public Records
Map
Nearby Homes
- 1841 Mills Ave
- 1816 Cleveland Ave
- 1901 Sherman Ave
- 1762 Cleveland Ave
- 2043 Lawrence Ave
- 1839 Hopkins Ave
- 2049 Sherman Ave
- 1812 Tilden Ave
- 4206 Lafayette Ave
- 4108 Montgomery Rd
- 1701 Sherman Ave
- 4719 Section Ave
- 1931 Waverly Ave
- 2030 Elm Ave
- 1952 Maple Ave
- 1827 Maple Ave
- 1819 Maple Ave
- 2223 Madison Ave
- 1907 Crown Ave
- 2005 Crown Ave
- 4318 Franklin Ave
- 1935 Courtland Ave
- 4306 Franklin Ave
- 1937 Courtland Ave
- 4302 Franklin Ave
- 4311 Allison St
- 4309 Allison St
- 4307 Allison St
- 4313 Allison St
- 4244 Franklin Ave
- 4404 Franklin Ave
- 4319 Franklin Ave
- 4305 Allison St
- 4315 Franklin Ave
- 1936 Courtland Ave
- 4317 Franklin Ave
- 4311 Franklin Ave
- 4401 Allison St
- 4307 Franklin Ave
- 4240 Franklin Ave
Your Personal Tour Guide
Ask me questions while you tour the home.