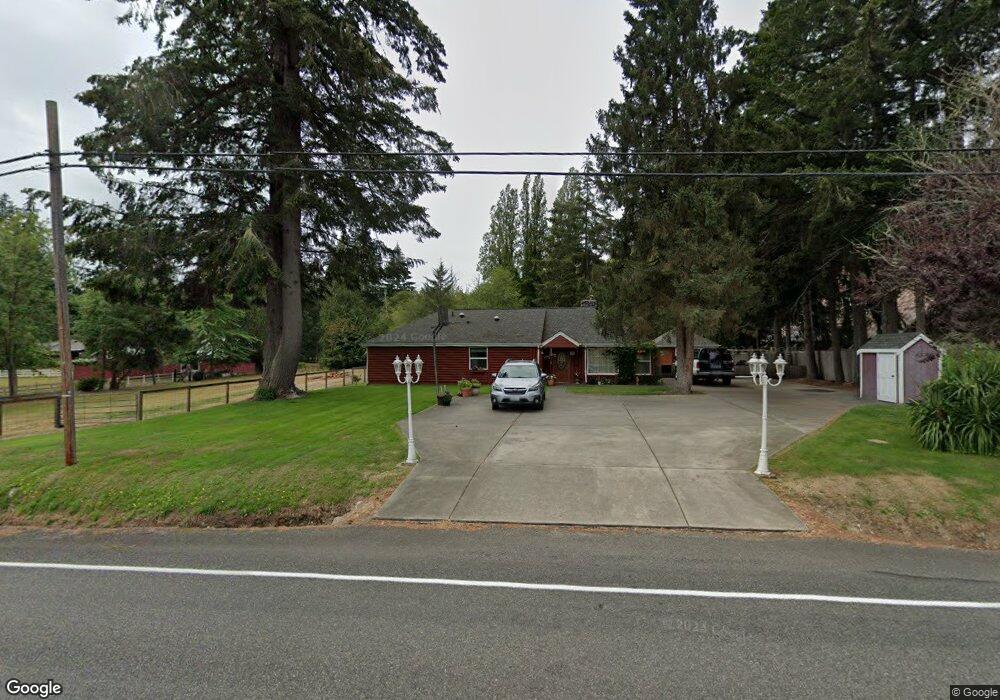
4314 Key Peninsula Hwy SW Longbranch, WA 98351
Estimated Value: $418,000 - $512,000
3
Beds
2
Baths
1,342
Sq Ft
$351/Sq Ft
Est. Value
About This Home
This home is located at 4314 Key Peninsula Hwy SW, Longbranch, WA 98351 and is currently estimated at $470,697, approximately $350 per square foot. 4314 Key Peninsula Hwy SW is a home located in Pierce County with nearby schools including Evergreen Elementary School, Key Peninsula Middle School, and Peninsula High School.
Ownership History
Date
Name
Owned For
Owner Type
Purchase Details
Closed on
Dec 8, 1998
Sold by
Jorgenson Patrick E
Bought by
Jorgenson Patrick E and Jorgenson Sheila D
Current Estimated Value
Home Financials for this Owner
Home Financials are based on the most recent Mortgage that was taken out on this home.
Original Mortgage
$94,500
Interest Rate
6.78%
Purchase Details
Closed on
Jul 1, 1997
Sold by
Jorgenson Sheila
Bought by
Jorgenson Patrick E
Home Financials for this Owner
Home Financials are based on the most recent Mortgage that was taken out on this home.
Original Mortgage
$90,000
Interest Rate
7.92%
Purchase Details
Closed on
Jun 1, 1997
Sold by
Smithee Kirk R
Bought by
Jorgenson Patrick E and Jorgenson Sheila
Home Financials for this Owner
Home Financials are based on the most recent Mortgage that was taken out on this home.
Original Mortgage
$90,000
Interest Rate
7.92%
Create a Home Valuation Report for This Property
The Home Valuation Report is an in-depth analysis detailing your home's value as well as a comparison with similar homes in the area
Home Values in the Area
Average Home Value in this Area
Purchase History
| Date | Buyer | Sale Price | Title Company |
|---|---|---|---|
| Jorgenson Patrick E | -- | Fidelity National Title | |
| Jorgenson Patrick E | -- | -- | |
| Jorgenson Patrick E | $100,000 | -- |
Source: Public Records
Mortgage History
| Date | Status | Borrower | Loan Amount |
|---|---|---|---|
| Closed | Jorgenson Patrick E | $94,500 | |
| Closed | Jorgenson Patrick E | $90,000 |
Source: Public Records
Tax History Compared to Growth
Tax History
| Year | Tax Paid | Tax Assessment Tax Assessment Total Assessment is a certain percentage of the fair market value that is determined by local assessors to be the total taxable value of land and additions on the property. | Land | Improvement |
|---|---|---|---|---|
| 2025 | $3,428 | $415,300 | $170,600 | $244,700 |
| 2024 | $3,428 | $392,900 | $166,000 | $226,900 |
| 2023 | $3,428 | $372,700 | $150,000 | $222,700 |
| 2022 | $3,020 | $373,200 | $132,800 | $240,400 |
| 2021 | $2,996 | $271,500 | $82,400 | $189,100 |
| 2019 | $2,563 | $244,600 | $67,600 | $177,000 |
| 2018 | $2,179 | $234,600 | $65,600 | $169,000 |
| 2017 | $2,179 | $199,300 | $49,500 | $149,800 |
| 2016 | $1,782 | $161,300 | $41,900 | $119,400 |
| 2014 | $1,763 | $136,600 | $40,300 | $96,300 |
| 2013 | $1,763 | $135,400 | $43,800 | $91,600 |
Source: Public Records
Map
Nearby Homes
- 912 Key Peninsula Hwy SW
- 4922 163rd Avenue Ct SW
- 5006 165th Ave SW
- 4101 161st Ave SW
- 16412 50th Street Ct SW
- 19789 Erickson Rd SW
- 18771 Erickson Rd SW
- 18771 & 19789 Erickson Rd SW
- 3009 174th Ave SW
- 3912 183rd Avenue Ct SW
- 15009 51st Street Ct SW
- 2721 158th Ave SW
- 4153 146th Ave SW
- 14528 45th St SW
- 14516 45th St SW Unit 10
- 14502 45th St SW
- 2219 Key Peninsula Hwy SW
- 1111 xxxx Whiteman Rd SW
- 6509 176th Ave SW
- 7515 Whiteman Rd SW
- 4420 Key Peninsula Hwy SW
- 16719 Erickson Road Kp S
- 16819 Erickson Rd SW
- 4420 Key Peninsula Hwy S
- 4417 Key Peninsula Hwy S
- 2 Erickson Rd Kps
- 16719 Erickson Rd SW
- 16715 Erickson Road Kp S
- 16715 Erickson Rd
- 4311 Key Peninsula Hwy SW
- 1 Erickson Rd Kps
- 0 XX Key Peninsula Hwy SW
- 0 X Key Peninsula Hwy SW
- 4417 Key Peninsula Hwy Kps
- 4515 Key Peninsula Hwy S
- 4117 Key Peninsula Hwy S
- 4516 Key Peninsula Hwy S
- 4516 Key Peninsula Hwy SW
- 16716 Erickson Rd SW
- 3 Erickson St Kps