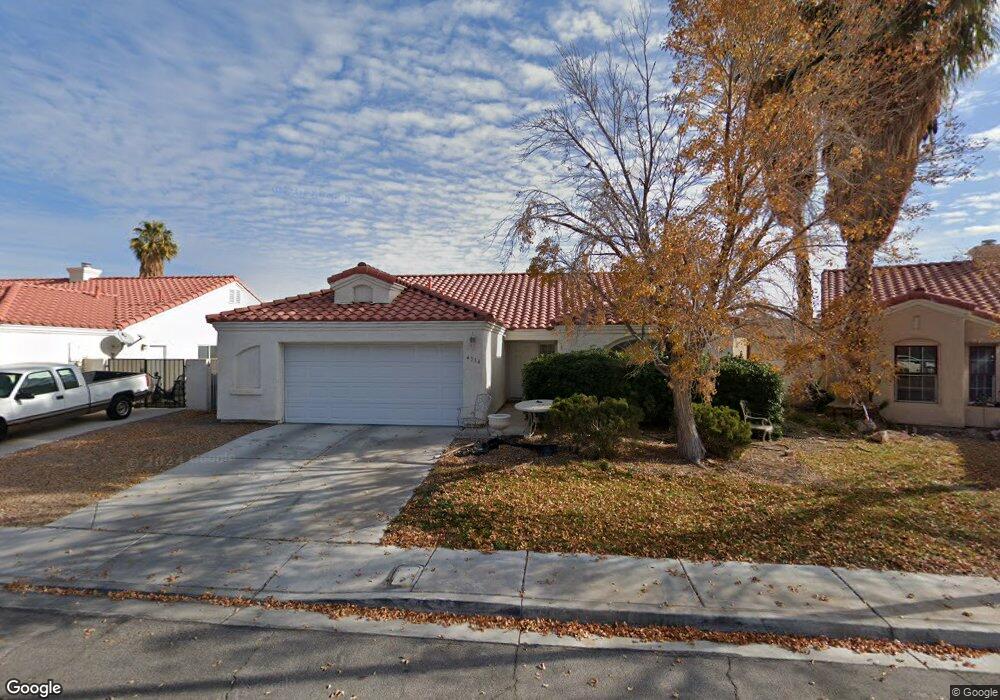
4314 La Ronda Cir North Las Vegas, NV 89032
Cheyenne NeighborhoodEstimated Value: $404,769 - $448,000
3
Beds
2
Baths
1,618
Sq Ft
$261/Sq Ft
Est. Value
About This Home
This home is located at 4314 La Ronda Cir, North Las Vegas, NV 89032 and is currently estimated at $421,692, approximately $260 per square foot. 4314 La Ronda Cir is a home located in Clark County with nearby schools including Lucile Bruner Elementary School, Theron L Swainston Middle School, and Cheyenne High School.
Ownership History
Date
Name
Owned For
Owner Type
Purchase Details
Closed on
Aug 23, 2002
Sold by
Mcdonald Monte
Bought by
Mcdonald Jeanne M
Current Estimated Value
Home Financials for this Owner
Home Financials are based on the most recent Mortgage that was taken out on this home.
Original Mortgage
$139,150
Outstanding Balance
$58,193
Interest Rate
6.52%
Estimated Equity
$363,499
Purchase Details
Closed on
Jul 15, 2002
Sold by
Mcdonald Jeanne M and Dechene Jeanne M
Bought by
Tucker William I
Home Financials for this Owner
Home Financials are based on the most recent Mortgage that was taken out on this home.
Original Mortgage
$139,150
Outstanding Balance
$58,193
Interest Rate
6.52%
Estimated Equity
$363,499
Purchase Details
Closed on
Jan 10, 1996
Sold by
Mcdonald Monte and Mcdonald Jeannie M
Bought by
Mcdonald Jeannie M
Home Financials for this Owner
Home Financials are based on the most recent Mortgage that was taken out on this home.
Original Mortgage
$10,000
Interest Rate
7.18%
Create a Home Valuation Report for This Property
The Home Valuation Report is an in-depth analysis detailing your home's value as well as a comparison with similar homes in the area
Home Values in the Area
Average Home Value in this Area
Purchase History
| Date | Buyer | Sale Price | Title Company |
|---|---|---|---|
| Mcdonald Jeanne M | -- | Stewart Title | |
| Tucker William I | $146,500 | Stewart Title | |
| Mcdonald Jeannie M | -- | Land Title |
Source: Public Records
Mortgage History
| Date | Status | Borrower | Loan Amount |
|---|---|---|---|
| Open | Tucker William I | $139,150 | |
| Previous Owner | Mcdonald Jeannie M | $10,000 |
Source: Public Records
Tax History Compared to Growth
Tax History
| Year | Tax Paid | Tax Assessment Tax Assessment Total Assessment is a certain percentage of the fair market value that is determined by local assessors to be the total taxable value of land and additions on the property. | Land | Improvement |
|---|---|---|---|---|
| 2025 | $1,421 | $82,711 | $28,000 | $54,711 |
| 2024 | $259 | $82,711 | $28,000 | $54,711 |
| 2023 | $259 | $82,198 | $29,750 | $52,448 |
| 2022 | $306 | $73,287 | $25,200 | $48,087 |
| 2021 | $1,203 | $67,974 | $22,050 | $45,924 |
| 2020 | $1,163 | $67,112 | $21,350 | $45,762 |
| 2019 | $1,129 | $61,988 | $16,800 | $45,188 |
| 2018 | $1,201 | $57,366 | $13,650 | $43,716 |
| 2017 | $1,825 | $57,045 | $12,600 | $44,445 |
| 2016 | $1,038 | $50,984 | $9,800 | $41,184 |
| 2015 | $1,036 | $39,803 | $7,000 | $32,803 |
| 2014 | $1,006 | $38,891 | $5,250 | $33,641 |
Source: Public Records
Map
Nearby Homes
- 4002 Extenso Dr
- 4013 Extenso Dr
- 4230 Valley Spruce Way
- 4115 Tatum Ct
- 4537 Colonial Canyon St
- 4108 Dove Creek Rd
- 3817 Dauntless Dr
- 4207 Oak Bay Way
- 3804 Dauntless Dr
- 3938 Redfield Ave
- 4528 Strato Jet Way
- 4448 Whelk Place
- 4001 Clove Tree Ct
- 4341 San Mateo St
- 4508 San Mateo St
- 4006 Clove Tree Ct
- 4335 Twin Peaks Dr
- 4508 W San Miguel Ave
- 3519 W Red Coach Ave
- 4640 Stearman Dr
- 4316 La Ronda Cir
- 4310 La Ronda Cir
- 4320 La Ronda Cir
- 4311 La Ronda Cir
- 4306 Bravita Dr
- 4302 Bravita Dr
- 4315 La Ronda Cir
- 4319 La Ronda Cir
- 4244 Bravita Dr
- 4107 Evita Ct
- 4240 Bravita Dr
- 4108 Evita Ct
- 4104 Evora Cir
- 4109 Palamos Dr
- 4111 Evita Ct
- 4236 Bravita Dr
- 4108 Evora Cir
- 4112 Evita Ct
- 4106 Palamos Dr
- 4113 Palamos Dr