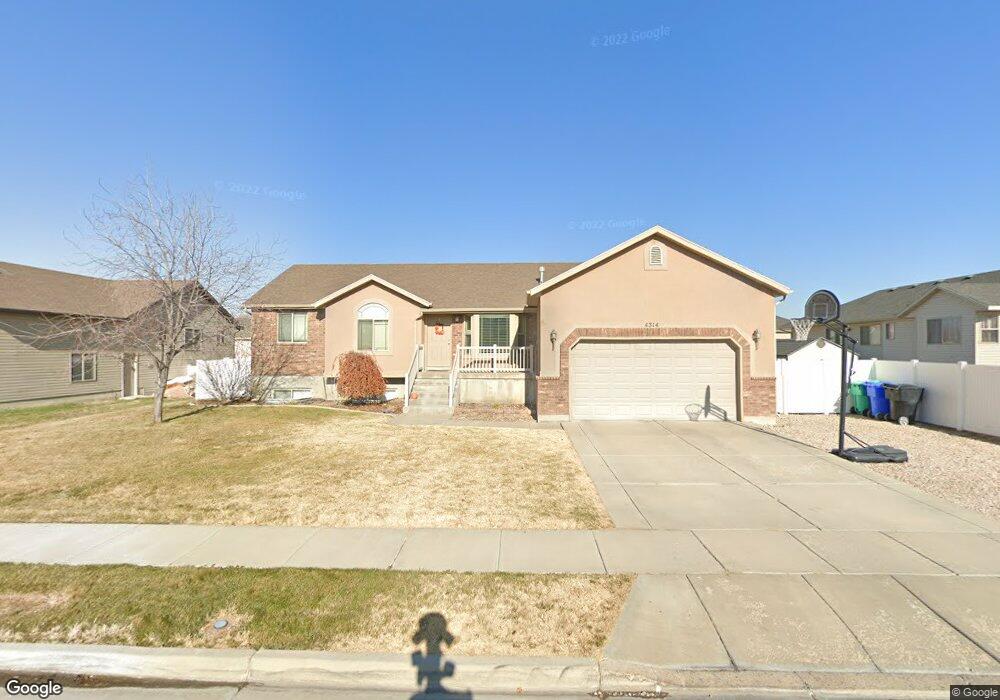
4314 W 1475 N West Point, UT 84015
Estimated Value: $509,000 - $623,000
3
Beds
2
Baths
2,875
Sq Ft
$194/Sq Ft
Est. Value
About This Home
This home is located at 4314 W 1475 N, West Point, UT 84015 and is currently estimated at $559,028, approximately $194 per square foot. 4314 W 1475 N is a home located in Davis County with nearby schools including West Point School, West Point Junior High School, and Syracuse High School.
Ownership History
Date
Name
Owned For
Owner Type
Purchase Details
Closed on
Aug 28, 2012
Sold by
Graham Tracy R and Graham Micah S
Bought by
Sandall Lincoln and Sandall Jamie
Current Estimated Value
Home Financials for this Owner
Home Financials are based on the most recent Mortgage that was taken out on this home.
Original Mortgage
$202,650
Outstanding Balance
$138,896
Interest Rate
3.37%
Mortgage Type
FHA
Estimated Equity
$420,132
Purchase Details
Closed on
Sep 18, 2007
Sold by
Dhi Builders Llc
Bought by
Graham Tracy R and Graham Micah S
Home Financials for this Owner
Home Financials are based on the most recent Mortgage that was taken out on this home.
Original Mortgage
$192,000
Interest Rate
6.57%
Mortgage Type
Purchase Money Mortgage
Purchase Details
Closed on
Apr 27, 2006
Sold by
M & D Developers Llc
Bought by
Dhi Builders Llc
Create a Home Valuation Report for This Property
The Home Valuation Report is an in-depth analysis detailing your home's value as well as a comparison with similar homes in the area
Home Values in the Area
Average Home Value in this Area
Purchase History
| Date | Buyer | Sale Price | Title Company |
|---|---|---|---|
| Sandall Lincoln | -- | Mountain View Title & | |
| Graham Tracy R | -- | Equity Title Ins Agency Inc | |
| Dhi Builders Llc | -- | Heritage West Title Ins Agen |
Source: Public Records
Mortgage History
| Date | Status | Borrower | Loan Amount |
|---|---|---|---|
| Open | Sandall Lincoln | $202,650 | |
| Previous Owner | Graham Tracy R | $192,000 |
Source: Public Records
Tax History Compared to Growth
Tax History
| Year | Tax Paid | Tax Assessment Tax Assessment Total Assessment is a certain percentage of the fair market value that is determined by local assessors to be the total taxable value of land and additions on the property. | Land | Improvement |
|---|---|---|---|---|
| 2025 | $2,856 | $274,450 | $111,253 | $163,197 |
| 2024 | $2,856 | $264,000 | $100,169 | $163,831 |
| 2023 | $2,654 | $451,000 | $124,342 | $326,658 |
| 2022 | $2,867 | $266,750 | $64,535 | $202,215 |
| 2021 | $2,609 | $363,000 | $101,391 | $261,609 |
| 2020 | $2,299 | $315,000 | $85,076 | $229,924 |
| 2019 | $2,208 | $298,000 | $82,570 | $215,430 |
| 2018 | $2,039 | $271,000 | $82,796 | $188,204 |
| 2016 | $1,872 | $130,515 | $32,026 | $98,489 |
| 2015 | $1,905 | $125,840 | $32,026 | $93,814 |
| 2014 | $1,815 | $121,315 | $32,026 | $89,289 |
| 2013 | -- | $111,701 | $33,494 | $78,207 |
Source: Public Records
Map
Nearby Homes
- 4302 W 1550 N
- 1717 N 4325 W
- 1635 N 4625 W
- 4061 W 1250 N Unit 1250
- 1124 N 4150 W
- 4469 W 1000 N Unit 120
- 2084 N 4500 W
- 3932 W 825 N Unit WF5
- 3918 W 825 N Unit WF6
- 4171 W 2425 N
- 4719 W 650 N
- 3784 W 2300 N
- 3762 W 2300 N
- 477 N 4500 W
- 2118 Snowy Crane Dr
- Torino Farmhouse Plan at Cranefield Estates
- 1700 Farmhouse Plan at Cranefield Estates - Estates Collection
- 2000 Traditional Plan at Cranefield Estates - Estates Collection
- Murano Traditional Plan at Cranefield Estates - Estates Collection
- 2400 Farmhouse Plan at Cranefield Estates - Estates Collection